OPEN-SOURCE SCRIPT
Telah dikemas kini Financial X-Ray

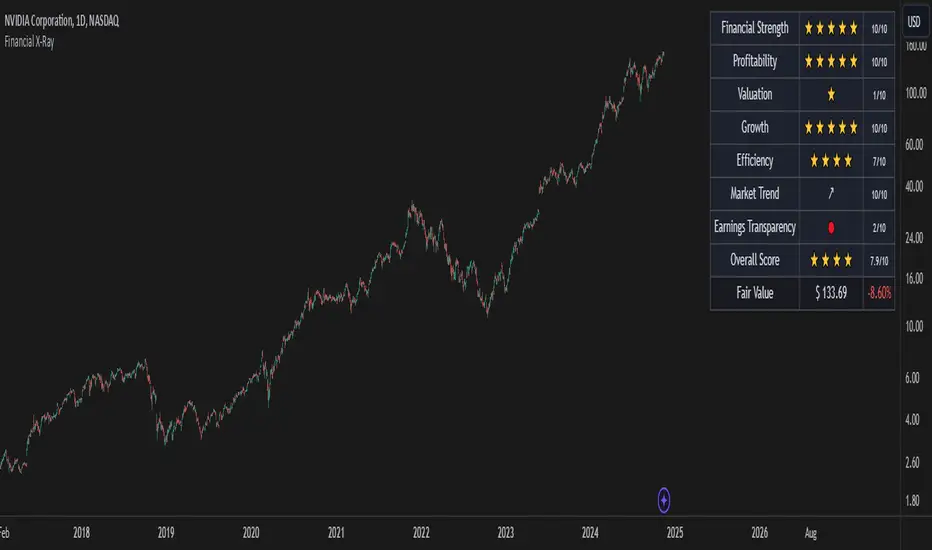
The Financial X-Ray is an advanced indicator designed to provide a thorough analysis of a company's financial health and market performance. Its primary goal is to offer investors and analysts a quick yet comprehensive overview of a company's financial situation by combining various key financial ratios and metrics.
How It Works
Advantages for Users
Customization and Evolution
One of the major strengths of this indicator is its open-source nature. Users can modify the code to adjust normalization methods, add new metrics, or adapt the display to their preferences. This flexibility allows the indicator to evolve and continuously improve through community contributions.
In summary, the Financial X-Ray is a powerful tool that combines automation, contextual analysis, and customization to provide investors with a clear and comprehensive view of companies' financial health, facilitating informed decision-making in financial markets.
This Financial X-Ray indicator is provided for informational and educational purposes only. It should not be considered as financial advice or a recommendation to buy or sell any security. The data and calculations used in this indicator may not be accurate or up-to-date. Users should always conduct their own research and consult with a qualified financial advisor before making any investment decisions. The creator of this indicator is not responsible for any losses or damages resulting from its use.
How It Works
- Data Collection: The indicator automatically extracts a wide range of financial data for the company, covering aspects such as financial strength, profitability, valuation, growth, and operational efficiency.
- Sector-Specific Normalization: A unique feature of this indicator is its ability to normalize metrics based on the company's industry sector. This approach allows for more relevant comparisons between companies within the same sector, taking into account industry-specific characteristics.
- Standardized Scoring: Each metric is converted to a score on a scale of 0 to 10, facilitating easy comparison and rapid interpretation of results.
- Multidimensional Analysis: The indicator doesn't focus on just one financial dimension but offers an overview by covering several crucial aspects of a company's performance.
- Fair Value Calculation: Using financial data and market conditions, the indicator provides an estimate of the company's fair value, offering a reference point for assessing current valuation.
- Visual Presentation: Results are displayed directly on the TradingView chart in a tabular format, allowing for quick and efficient reading of key information.
Advantages for Users
- Time-Saving: Instead of manually collecting and analyzing numerous financial data points, users get an instant comprehensive overview.
- Contextual Analysis: Sector-specific normalization allows for a better understanding of the company's performance relative to its peers.
- Flexibility: Users can choose which metrics to display, customizing the analysis to their specific needs.
- Objectivity: By relying on quantitative data and standardized calculations, the indicator offers an objective perspective on the company's financial health.
- Decision Support: The fair value estimate and normalized scores provide valuable reference points for investment decision-making.
Customization and Evolution
One of the major strengths of this indicator is its open-source nature. Users can modify the code to adjust normalization methods, add new metrics, or adapt the display to their preferences. This flexibility allows the indicator to evolve and continuously improve through community contributions.
In summary, the Financial X-Ray is a powerful tool that combines automation, contextual analysis, and customization to provide investors with a clear and comprehensive view of companies' financial health, facilitating informed decision-making in financial markets.
This Financial X-Ray indicator is provided for informational and educational purposes only. It should not be considered as financial advice or a recommendation to buy or sell any security. The data and calculations used in this indicator may not be accurate or up-to-date. Users should always conduct their own research and consult with a qualified financial advisor before making any investment decisions. The creator of this indicator is not responsible for any losses or damages resulting from its use.
Nota Keluaran
Small bugs fixedSkrip sumber terbuka
Dalam semangat TradingView sebenar, pencipta skrip ini telah menjadikannya sumber terbuka, jadi pedagang boleh menilai dan mengesahkan kefungsiannya. Terima kasih kepada penulis! Walaupuan anda boleh menggunakan secara percuma, ingat bahawa penerbitan semula kod ini tertakluk kepada Peraturan Dalaman.
Plan the trade ⚡ Trade the plan
Penafian
Maklumat dan penerbitan adalah tidak bertujuan, dan tidak membentuk, nasihat atau cadangan kewangan, pelaburan, dagangan atau jenis lain yang diberikan atau disahkan oleh TradingView. Baca lebih dalam Terma Penggunaan.
Skrip sumber terbuka
Dalam semangat TradingView sebenar, pencipta skrip ini telah menjadikannya sumber terbuka, jadi pedagang boleh menilai dan mengesahkan kefungsiannya. Terima kasih kepada penulis! Walaupuan anda boleh menggunakan secara percuma, ingat bahawa penerbitan semula kod ini tertakluk kepada Peraturan Dalaman.
Plan the trade ⚡ Trade the plan
Penafian
Maklumat dan penerbitan adalah tidak bertujuan, dan tidak membentuk, nasihat atau cadangan kewangan, pelaburan, dagangan atau jenis lain yang diberikan atau disahkan oleh TradingView. Baca lebih dalam Terma Penggunaan.