PROTECTED SOURCE SCRIPT
PpSigan ZigZag++
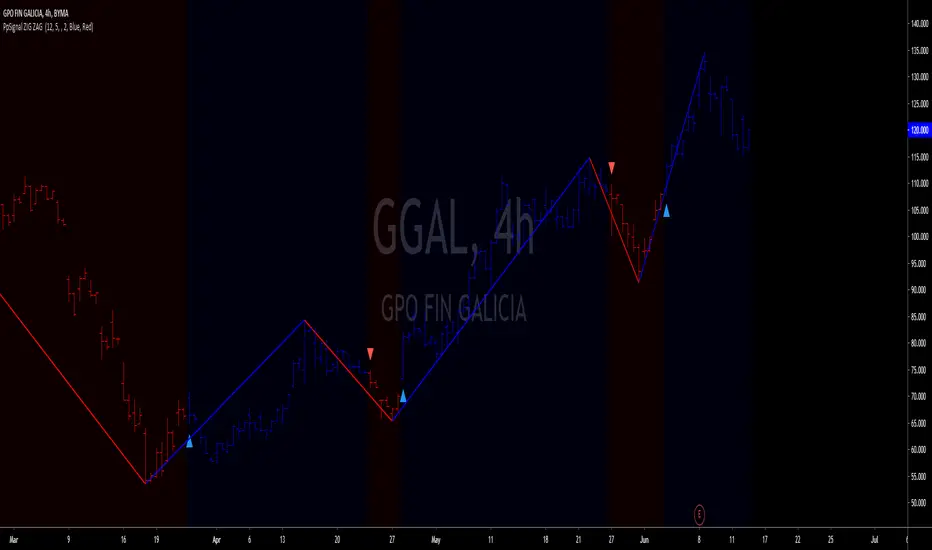
The Zig Zag indicator plots points on the chart whenever prices reverse by a percentage greater than a pre-chosen variable. Straight lines are then drawn, connecting these points. The indicator is used to help identify price trends. It eliminates random price fluctuations and attempts to show trend changes. Zig Zag lines only appear when there is a price movement between a swing high and a swing low that is greater than a specified percentage; often 5%. By filtering minor price movements, the indicator makes trends easier to spot in all time frames.
Buy when the price is blue or green choose your favorite up color and arrow is up.
sell when the price is red or orange choose your favorite up color and arrow is up.
Buy when the price is blue or green choose your favorite up color and arrow is up.
sell when the price is red or orange choose your favorite up color and arrow is up.
Skrip dilindungi
Skrip ini diterbitkan sebagai sumber tertutup. Akan tetapi, anda boleh menggunakannya secara bebas dan tanpa apa-apa had – ketahui lebih di sini.
Penafian
Maklumat dan penerbitan adalah tidak bertujuan, dan tidak membentuk, nasihat atau cadangan kewangan, pelaburan, dagangan atau jenis lain yang diberikan atau disahkan oleh TradingView. Baca lebih dalam Terma Penggunaan.