PROTECTED SOURCE SCRIPT
Sk-Macd Trend
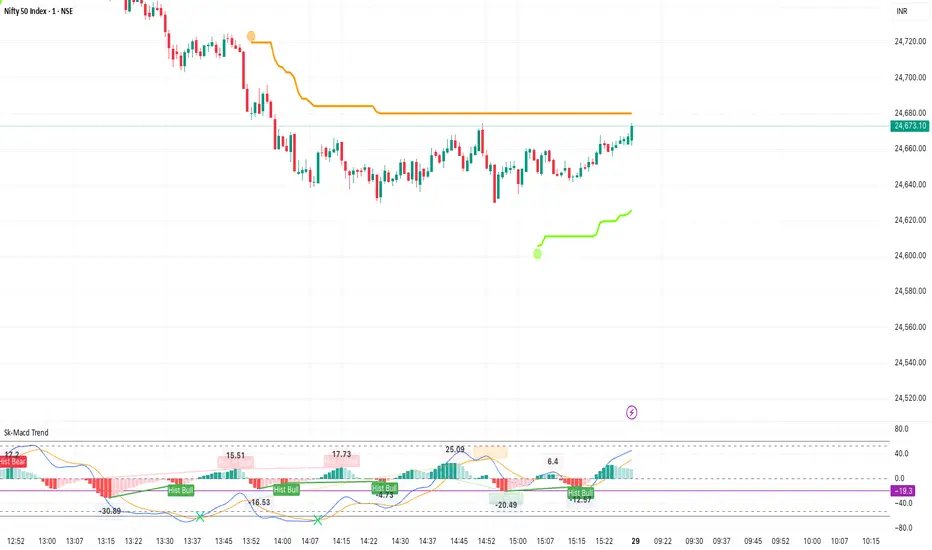
Publication Note for "Sk Macd Trend" IndicatorWe are excited to announce the release of the "Sk Macd Trend" indicator, a robust and versatile tool designed for traders to identify market trends, momentum, and potential reversal points. This indicator, developed by Sujeetjeet1705, is licensed under the Mozilla Public License 2.0 (mozilla.org/MPL/2.0/).Key Features:Wave Trend Oscillator:Customizable channel length, average length, and overbought/oversold levels.
Optional Laguerre smoothing for enhanced signal clarity using a configurable gamma factor.
Visualizes MACD and Signal lines to track momentum and trend direction.
Histogram:Displays the difference between MACD and Signal as a histogram (Hist), with color-coded bars to indicate bullish or bearish momentum strength.
Supports both SMA and EMA for oscillator and signal line calculations, with adjustable signal smoothing.
Trailing Stop:Implements ATR-based trailing stops for bullish and bearish positions, with customizable multiplier and line width.
Option to filter signals based on trend direction (MACD above/below zero).
Visual cues for trailing stop initiations and stop-loss hits, enhancing trade management.
Divergence Detection:Identifies regular and hidden bullish/bearish divergences on both the Signal line and Hist (histogram).
Configurable lookback periods and range settings for precise divergence detection.
Clear visual labels and color-coded plots for easy interpretation of divergence signals.
Usage:Wave Trend Settings: Adjust channel length, average length, and overbought/oversold levels to suit your trading style.
Histogram Settings: Enable/disable the histogram and choose between SMA or EMA for smoothing.
Trailing Stop: Enable trend-based filtering and tweak the ATR multiplier for tighter or looser stops.
Divergence Settings: Customize pivot lookback and range parameters to detect divergences that align with your strategy.
Notes:The indicator is non-overlay and designed for use in a separate panel below the price chart.
Visual elements include MACD and Signal lines, Hist bars, buy/sell signals, trailing stop lines, and divergence labels for comprehensive analysis.
The code is optimized for performance with a maximum of 100 polylines for trailing stops.
Licensing:This indicator is released under the Mozilla Public License 2.0. For details, visit mozilla.org/MPL/2.0/.Acknowledgements:Developed by ©Sujeetjeet1705, this indicator combines advanced technical analysis tools to empower traders with actionable insights. We encourage feedback and suggestions to further enhance its functionality.Happy trading!
Sujeetjeet1705
Skrip dilindungi
Skrip ini diterbitkan sebagai sumber tertutup. Akan tetapi, anda boleh menggunakannya dengan percuma dan tanpa had – ketahui lebih lanjut di sini.
Penafian
Maklumat dan penerbitan adalah tidak dimaksudkan untuk menjadi, dan tidak membentuk, nasihat untuk kewangan, pelaburan, perdagangan dan jenis-jenis lain atau cadangan yang dibekalkan atau disahkan oleh TradingView. Baca dengan lebih lanjut di Terma Penggunaan.