OPEN-SOURCE SCRIPT
Telah dikemas kini XGBoost Approximation Indicator with HTF Filter Ver. 3.2

XGBoost Approx Indicator with Higher Timeframe Filter Ver. 3.2
What It Is
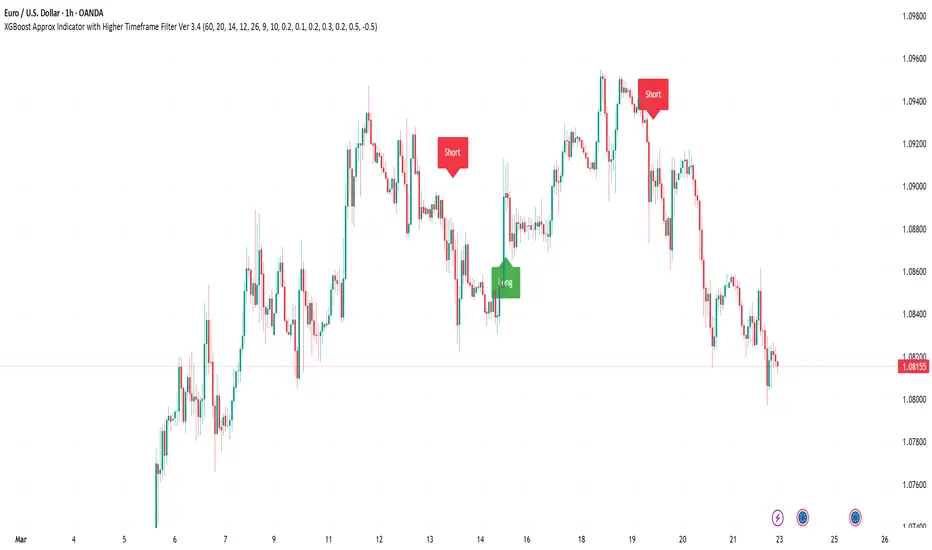
The XGBoost Approx Indicator is a technical analysis tool designed to generate trading signals based on a composite of multiple indicators. It combines Simple Moving Average (SMA), Relative Strength Index (RSI), MACD, Rate of Change (ROC), and Volume to create a composite indicator score. Additionally, it incorporates a higher timeframe filter (HTF) to enhance trend confirmation and reduce false signals.
This indicator helps traders identify long (buy) and short (sell) opportunities based on a weighted combination of trend-following and momentum indicators.
How to Use It Properly
Setup and Configuration:
Add the indicator to your TradingView chart.
Customize input settings based on your trading strategy. Key configurable inputs include:
HTF filter (default: 1-hour)
SMA, RSI, MACD, and ROC lengths
Custom weightings for each component
Thresholds for buy and sell signals
Understanding the Signals:
Green "Long" Label: Appears when the composite indicator crosses above the buy threshold, signaling a potential buy opportunity.
Red "Short" Label: Appears when the composite indicator crosses below the sell threshold, signaling a potential sell opportunity.
These signals are filtered by a higher timeframe SMA trend to improve accuracy.
Alerts:
The indicator provides alert conditions for long and short entries.
Traders can enable alerts in TradingView to receive real-time notifications when a new signal is triggered.
Safety and Best Practices
Use in Conjunction with Other Analysis: Do not rely solely on this indicator. Combine it with price action, support/resistance levels, and fundamental analysis for better decision-making.
Adjust Settings for Your Strategy: The default settings may not suit all markets or timeframes. Test different configurations before trading live.
Backtest Before Using in Live Trading: Evaluate the indicator’s past performance on historical data to assess its effectiveness in different market conditions.
Avoid Overtrading: False signals can occur, especially in low volatility or choppy markets. Use additional confirmation (e.g., trendlines or moving averages).
Risk Management: Always set stop-loss levels and position sizes to limit potential losses.
Nota Keluaran
There us an update on the script, now it is Version 3.3Calculations weights are now more balanced as Volume got 0.2 as of 20% contribution of the composite indicator.
Composite indicator is a simplified show of the results of multiple indicators. Calculations are the following:
compositeIndicator = (weightSMA * smaNormalized) +
(weightRSI * rsiNormalized) +
(weightMACD * macdNormalized) +
(weightROC * rocNormalized) +
(weightVolume * volumeNormalized)
So compositeIndicator are calculated from the last 50 bars, their values are normalized between the range of -1.0 and 1.0
Sell when the compositeIndicator is below (adjustable) -0.5 and buy when exceeds 0.5
I recommend to use the last bars or high/lows adding maximim 1% of balance risk.
Exit position either you get 2-3x your R:R or the indicator makes an alert for the another directon.
Nota Keluaran
Update notes:22 Marc 2025
Barmerger set to off to make the scriopt more robust.
The script was converted to Pinescript 6.
Skrip sumber terbuka
Dalam semangat TradingView sebenar, pencipta skrip ini telah menjadikannya sumber terbuka, jadi pedagang boleh menilai dan mengesahkan kefungsiannya. Terima kasih kepada penulis! Walaupuan anda boleh menggunakan secara percuma, ingat bahawa penerbitan semula kod ini tertakluk kepada Peraturan Dalaman.
Penafian
Maklumat dan penerbitan adalah tidak bertujuan, dan tidak membentuk, nasihat atau cadangan kewangan, pelaburan, dagangan atau jenis lain yang diberikan atau disahkan oleh TradingView. Baca lebih dalam Terma Penggunaan.