OPEN-SOURCE SCRIPT
Katik Cycle 56 Days
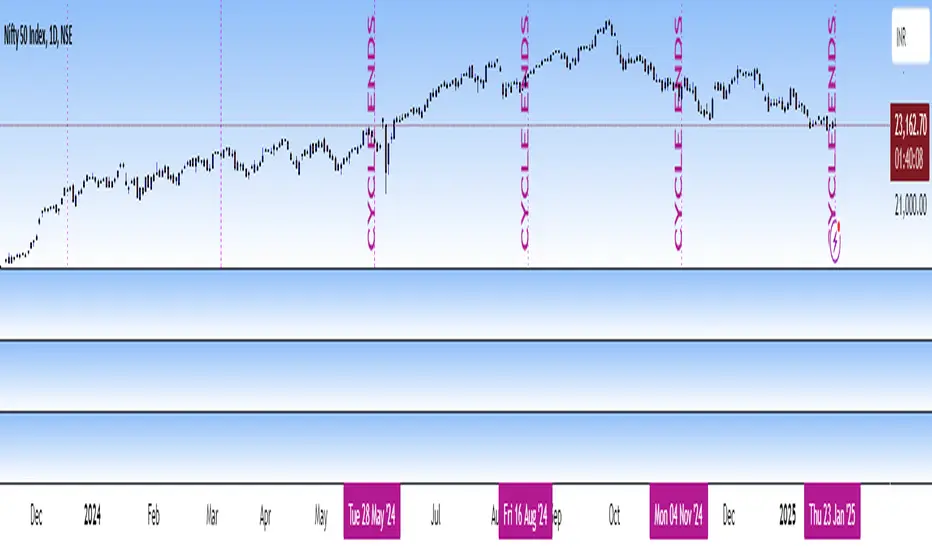
This script plots vertical dotted lines on the chart every 56 trading days, starting from the first bar. It calculates intervals based on the bar_index and draws the lines for both historical and future dates by projecting the lines forward.
The lines are extended across the entire chart height using extend=extend.both, ensuring visibility regardless of chart zoom level. You can customize the interval length using the input box.
Note: Use this only for 1D (Day) candle so that you can find the changes in the trend...
The lines are extended across the entire chart height using extend=extend.both, ensuring visibility regardless of chart zoom level. You can customize the interval length using the input box.
Note: Use this only for 1D (Day) candle so that you can find the changes in the trend...
Skrip sumber terbuka
Dalam semangat TradingView sebenar, pencipta skrip ini telah menjadikannya sumber terbuka, jadi pedagang boleh menilai dan mengesahkan kefungsiannya. Terima kasih kepada penulis! Walaupuan anda boleh menggunakan secara percuma, ingat bahawa penerbitan semula kod ini tertakluk kepada Peraturan Dalaman.
Penafian
Maklumat dan penerbitan adalah tidak bertujuan, dan tidak membentuk, nasihat atau cadangan kewangan, pelaburan, dagangan atau jenis lain yang diberikan atau disahkan oleh TradingView. Baca lebih dalam Terma Penggunaan.