PROTECTED SOURCE SCRIPT
[blackcat] L3 Chip Trends
Level 3 (Stock ONLY)
Background
Chip theory is an intersting TA for trading. The profit and loss (pnl) ratio represents the ratio of profit-making or loss-making orders in the current market. The larger the profit ratio, the more investors are in a profitable state. Stock chip analysis is a kind of stock technical analysis. Investors can analyze it in combination with other indicators and data.
Function
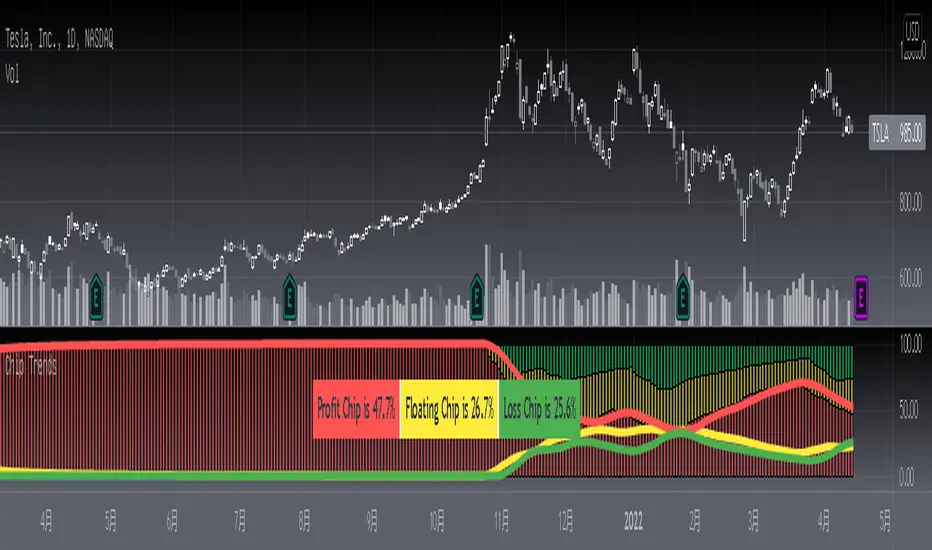
This is a chip distribution and trend indicator I developed that consists of three different colored histograms. Yellow represents the percentage of floating chips, green represents the percentage of hold-ups, and red represents the percentage of profit. Among them, the more red columns, the more profitable chips, the more green columns, the more trapped chips. At the same time, I used three colored moving averages to represent the trends of these three types of chips for reference. At the same time, a table will appear in the middle of the indicator, indicating the chip ratio value of the latest bar in the form of a percentage.
Key Signal
profit chip percentage and trend--> red color
floating chip percentage and trend --> yellow color
loss chip percentage and trend --> green color
Remarks
This is a Level 3 free and closed source indicator.
NOT applicable for instruments except stocks.
Feedbacks are appreciated.
Background
Chip theory is an intersting TA for trading. The profit and loss (pnl) ratio represents the ratio of profit-making or loss-making orders in the current market. The larger the profit ratio, the more investors are in a profitable state. Stock chip analysis is a kind of stock technical analysis. Investors can analyze it in combination with other indicators and data.
Function
This is a chip distribution and trend indicator I developed that consists of three different colored histograms. Yellow represents the percentage of floating chips, green represents the percentage of hold-ups, and red represents the percentage of profit. Among them, the more red columns, the more profitable chips, the more green columns, the more trapped chips. At the same time, I used three colored moving averages to represent the trends of these three types of chips for reference. At the same time, a table will appear in the middle of the indicator, indicating the chip ratio value of the latest bar in the form of a percentage.
Key Signal
profit chip percentage and trend--> red color
floating chip percentage and trend --> yellow color
loss chip percentage and trend --> green color
Remarks
This is a Level 3 free and closed source indicator.
NOT applicable for instruments except stocks.
Feedbacks are appreciated.
Skrip dilindungi
Skrip ini diterbitkan sebagai sumber tertutup. Akan tetapi, anda boleh menggunakannya secara bebas dan tanpa apa-apa had – ketahui lebih di sini.
Avoid losing contact!Don't miss out! The first and most important thing to do is to join my Discord chat now! Click here to start your adventure: discord.com/invite/ZTGpQJq 防止失联,请立即行动,加入本猫聊天群: discord.com/invite/ZTGpQJq
Penafian
Maklumat dan penerbitan adalah tidak bertujuan, dan tidak membentuk, nasihat atau cadangan kewangan, pelaburan, dagangan atau jenis lain yang diberikan atau disahkan oleh TradingView. Baca lebih dalam Terma Penggunaan.