$ADD Indicator
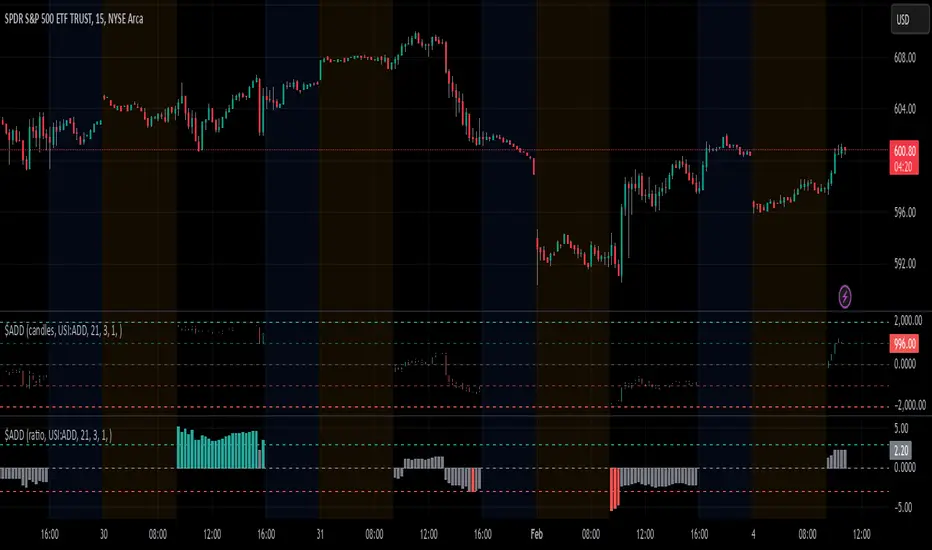
In index investment, the USI:ADD is the Advance Decline Index that can be plotted in most charting platforms. Just like there is a volatility index for most major indeces (VIX, VOLQ) and even for Apple (CBOE:VXAPL), USI:ADD also has variations specific for the index you are analyzing (SPX: ADD, NASDAQ: ADDQ).
The USI:ADD index is a measurement of stocks in the index that are advancing (bullish) minus those that are declining (bearish).
The basic idea of how to use the ADD index is that when the value is above 1000 it is considered overbought. Conversely, when the value is below -1000 it is considered oversold. When the value is near the medium line, it is not a good idea to trade as it is considered to be in a choppy market.
Skrip jemputan sahaja
Hanya pengguna disahkan oleh penulis boleh mengakses skrip ini. Anda perlu memohon dan mendapatkan kebenaran untuk menggunakannya. Keizinan selalunya diberikan selepas pembayaran. Untuk lebih butiran, ikuti arahan penulis di bawah atau hubungi TickSurfers secara terus.
Ambil maklum bahawa skrip peribadi dan jemputan sahaja ini masih belum disemak oleh moderator skrip dan pematuhannya dengan Peraturan Dalaman adalah belum ditentukan. TradingView TIDAK menyarankan pembayaran atau penggunaan skrip kecuali anda mempercayai sepenuhnya penulis dan memahami bagaimana ia berfungsi. Anda juga boleh menjumpai alternatif sumber terbuka dan percuma yang lain di dalam skrip komuniti kami.
Arahan penulis
Penafian
Skrip jemputan sahaja
Hanya pengguna disahkan oleh penulis boleh mengakses skrip ini. Anda perlu memohon dan mendapatkan kebenaran untuk menggunakannya. Keizinan selalunya diberikan selepas pembayaran. Untuk lebih butiran, ikuti arahan penulis di bawah atau hubungi TickSurfers secara terus.
Ambil maklum bahawa skrip peribadi dan jemputan sahaja ini masih belum disemak oleh moderator skrip dan pematuhannya dengan Peraturan Dalaman adalah belum ditentukan. TradingView TIDAK menyarankan pembayaran atau penggunaan skrip kecuali anda mempercayai sepenuhnya penulis dan memahami bagaimana ia berfungsi. Anda juga boleh menjumpai alternatif sumber terbuka dan percuma yang lain di dalam skrip komuniti kami.