OPEN-SOURCE SCRIPT
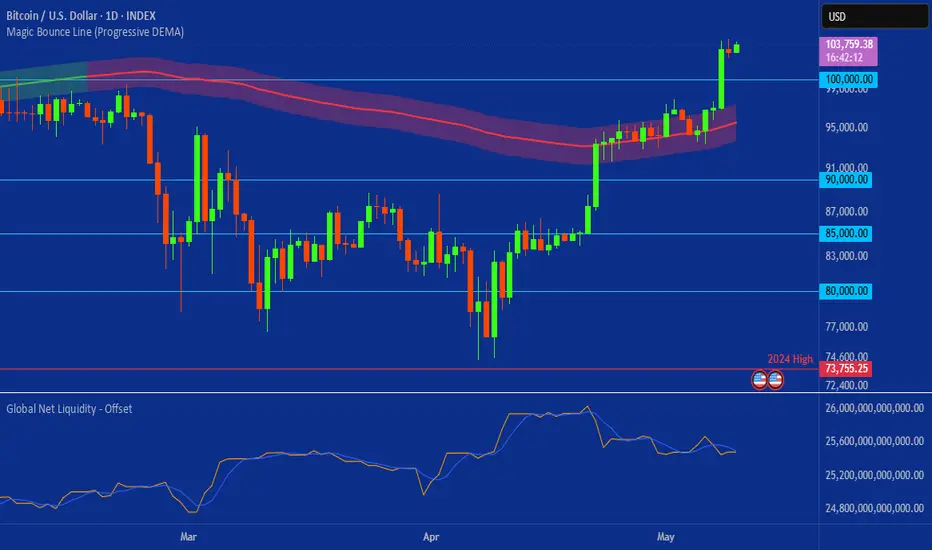
Global Net Liquidity - Offset
Purpose
This indicator tracks the combined balance-sheet liquidity provided by the world’s five largest central banks, then subtracts the U.S. Treasury General Account (TGA) and the Fed’s Reverse Repo Facility (RRP).
The result is a high-level proxy for global US-dollar availability that many market participants see leading risk-asset trends.
Formula
Fed Assets (FRED: WALCL)
+ BoJ Assets × USDJPY
+ PBoC Assets × USDCNY
+ BoE Assets × USDGBP
+ ECB Assets × USDEUR
– Fed RRP (FRED: RRPONTSYD)
– Treasury General Account (FRED: WTREGEN)
All series are converted to USD and summed on a daily basis.
What’s new in this version
Plot Offset – Shift the curve forward or backward ±500 trading days (positive = future) to visualise the commonly cited 10 to 12 week lead/lag between liquidity and equity indices.
Optional Smoothing – Apply either a Simple Moving Average (SMA) or Exponential Moving Average (EMA) of any length to damp daily noise and focus on structural turns.
How to use it
- Add the script to a separate pane on a daily-time-frame chart (e.g., SPX, BTC-USD).
- Adjust Plot Offset until major peaks/troughs in liquidity line up with market turns; many traders start near +50 trading days.
- Optionally Toggle Apply Smoothing and choose SMA or EMA when abrupt central-bank balance-sheet moves create visual “spikes.”
Credits & licence
Originally published as “Global Net Liquidity” by dharmatech under the Mozilla Public License 2.0. This fork by LabOfCrypto adds offset and smoothing, plus minor usability tweaks. It remains open-source under the MPL-2.0.
Disclaimer
For educational purposes only. Past liquidity patterns do not guarantee future market behaviour; always combine with sound risk management.
Skrip sumber terbuka
Dalam semangat TradingView sebenar, pencipta skrip ini telah menjadikannya sumber terbuka, jadi pedagang boleh menilai dan mengesahkan kefungsiannya. Terima kasih kepada penulis! Walaupuan anda boleh menggunakan secara percuma, ingat bahawa penerbitan semula kod ini tertakluk kepada Peraturan Dalaman.
Penafian
Maklumat dan penerbitan adalah tidak bertujuan, dan tidak membentuk, nasihat atau cadangan kewangan, pelaburan, dagangan atau jenis lain yang diberikan atau disahkan oleh TradingView. Baca lebih dalam Terma Penggunaan.