PROTECTED SOURCE SCRIPT
Telah dikemas kini Stablecoins $ Growth Rate % [SwissAlgo]
🧠 Description
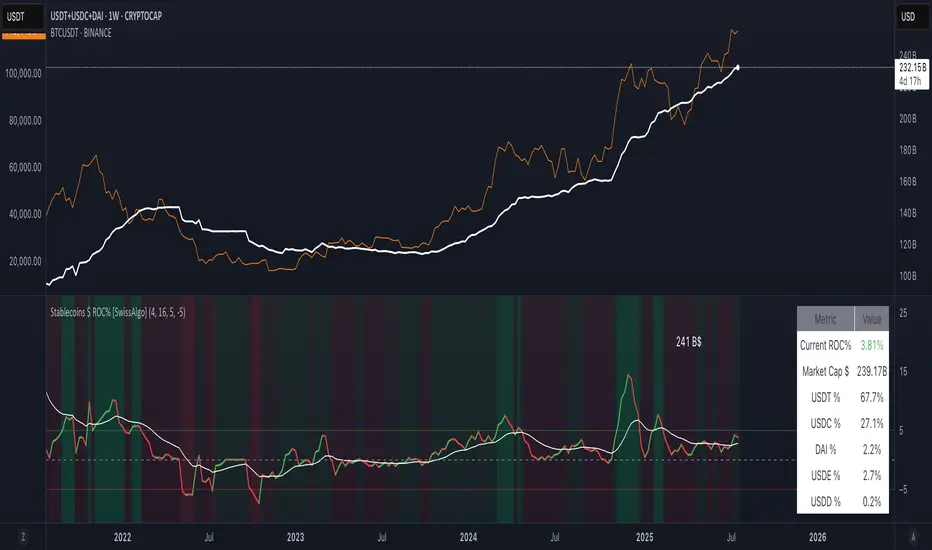
This indicator tracks the percentage growth rate (ROC%) of the global market capitalization in $ of major stablecoins over a configurable lookback period.
It provides a macro view of capital inflows and outflows from stable assets, which may be seen as a potential signal for upcoming crypto market expansions or contractions.
The 1W timeframe is recommended for this indicator to filter out noise.
To see the total market cap of the monitored stablecoins, please use this formula:
CRYPTOCAP:USDT + CRYPTOCAP:USDC + CRYPTOCAP:DAI
💡 How It Works
The script aggregates and monitors the market cap data in $ of the following stablecoins, sourced from TradingView's CRYPTOCAP: tickers:
It calculates the rate of change (ROC%) in total stablecoin capitalization over a user-defined period. A positive ROC% may indicate growing confidence or liquidity entering the market. A declining ROC% might precede selloffs or reduced market appetite.
To improve interpretation, the indicator:
1. Includes an optional moving average of the growth rate
2. Colors the background dynamically:
🟢 Light/dark green when growth is increasing or accelerating
🔴 Light/dark red when growth is declining or weakening
3. Displays an info table showing the current ROC%, total stablecoin market cap, and percentage breakdown of each coin
🛎️ Alerts
Built-in alerts will notify you when:
These thresholds help identify extreme inflows/outflows that may impact risk-on/risk-off behavior in broader crypto markets.
📈 Use Case
This tool may be helpful for:
🛠️ Customization
You can:
⚠️ Notes
Due to limited historical data on newer stablecoins (e.g., USDE, USD1), the full growth rate history may appear flat before their launch dates.
This is non-financial advice. Please do your own research before taking investment decisions, and do not risk more than you can afford to lose.
This indicator tracks the percentage growth rate (ROC%) of the global market capitalization in $ of major stablecoins over a configurable lookback period.
It provides a macro view of capital inflows and outflows from stable assets, which may be seen as a potential signal for upcoming crypto market expansions or contractions.
The 1W timeframe is recommended for this indicator to filter out noise.
To see the total market cap of the monitored stablecoins, please use this formula:
CRYPTOCAP:USDT + CRYPTOCAP:USDC + CRYPTOCAP:DAI
💡 How It Works
The script aggregates and monitors the market cap data in $ of the following stablecoins, sourced from TradingView's CRYPTOCAP: tickers:
- USDT
- USDC
- DAI
- USDE (Ethena)
- USD1 (Mountain Protocol)
- USDD
It calculates the rate of change (ROC%) in total stablecoin capitalization over a user-defined period. A positive ROC% may indicate growing confidence or liquidity entering the market. A declining ROC% might precede selloffs or reduced market appetite.
To improve interpretation, the indicator:
1. Includes an optional moving average of the growth rate
2. Colors the background dynamically:
🟢 Light/dark green when growth is increasing or accelerating
🔴 Light/dark red when growth is declining or weakening
3. Displays an info table showing the current ROC%, total stablecoin market cap, and percentage breakdown of each coin
🛎️ Alerts
Built-in alerts will notify you when:
- Growth exceeds an upper threshold (default, +5%)
- Growth drops below a lower threshold (default, -5%)
These thresholds help identify extreme inflows/outflows that may impact risk-on/risk-off behavior in broader crypto markets.
📈 Use Case
This tool may be helpful for:
- Macro traders watching capital rotation trends
- Altcoin investors timing entries after stablecoin expansions
- Analysts identifying inflection points in crypto sentiment
- Quant/systematic traders as a filter for long/short regimes
🛠️ Customization
You can:
- Adjust the growth window and the moving average length
- Show/hide the MA and zero line
- Adjust the upper/lower thresholds for remarkable ROC growth/decline
⚠️ Notes
Due to limited historical data on newer stablecoins (e.g., USDE, USD1), the full growth rate history may appear flat before their launch dates.
This is non-financial advice. Please do your own research before taking investment decisions, and do not risk more than you can afford to lose.
Nota Keluaran
Removed USD1, as no longer available in CRYPTOCAPSkrip dilindungi
Skrip ini diterbitkan sebagai sumber tertutup. Akan tetapi, anda boleh menggunakannya secara bebas dan tanpa apa-apa had – ketahui lebih di sini.
Penafian
Maklumat dan penerbitan adalah tidak bertujuan, dan tidak membentuk, nasihat atau cadangan kewangan, pelaburan, dagangan atau jenis lain yang diberikan atau disahkan oleh TradingView. Baca lebih dalam Terma Penggunaan.
Skrip dilindungi
Skrip ini diterbitkan sebagai sumber tertutup. Akan tetapi, anda boleh menggunakannya secara bebas dan tanpa apa-apa had – ketahui lebih di sini.
Penafian
Maklumat dan penerbitan adalah tidak bertujuan, dan tidak membentuk, nasihat atau cadangan kewangan, pelaburan, dagangan atau jenis lain yang diberikan atau disahkan oleh TradingView. Baca lebih dalam Terma Penggunaan.