OPEN-SOURCE SCRIPT
Telah dikemas kini Relative chart analysis using arithmetic operators
Relative chart analysis using arithmetic operators.
Nota Keluaran
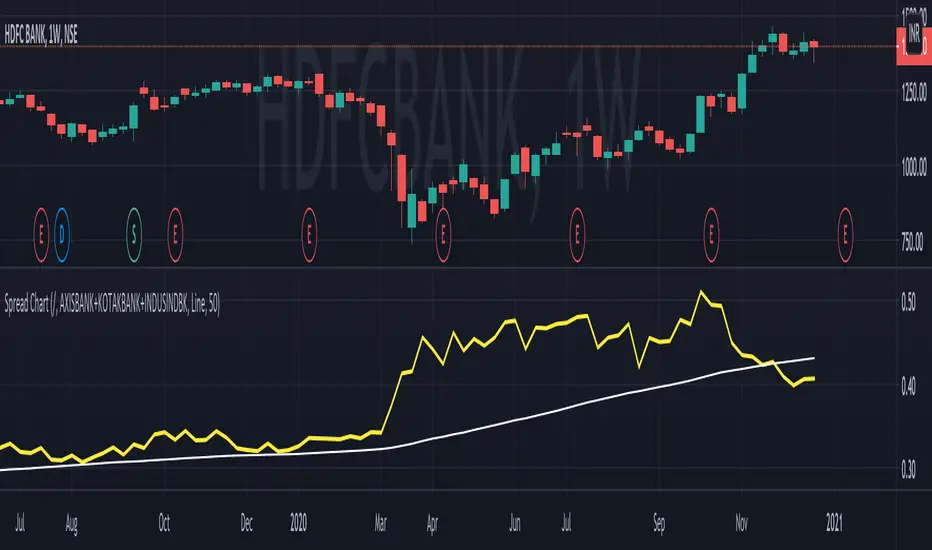
- Now line plots are available and the default option
- The 50 Period Moving Average is also plotted by default
Usage:
On can plot a combination of number of mathematical operators. The input source, can itself also be a combination of different scrips. For example, in this example, we compare (divide / ) HDFCBANK with a "synthetic benchmark" of other competing private banks by combining (AXIS + KOTAK + INDUSIND) in the input.
Skrip sumber terbuka
Dalam semangat TradingView sebenar, pencipta skrip ini telah menjadikannya sumber terbuka, jadi pedagang boleh menilai dan mengesahkan kefungsiannya. Terima kasih kepada penulis! Walaupuan anda boleh menggunakan secara percuma, ingat bahawa penerbitan semula kod ini tertakluk kepada Peraturan Dalaman.
Penafian
Maklumat dan penerbitan adalah tidak bertujuan, dan tidak membentuk, nasihat atau cadangan kewangan, pelaburan, dagangan atau jenis lain yang diberikan atau disahkan oleh TradingView. Baca lebih dalam Terma Penggunaan.