OPEN-SOURCE SCRIPT
Intraday Mean Reversion Main
The Intraday Mean Reversion Indicator works well on certain stocks. It should be used for day trading stocks but need to be applied on the Day to Day timeframe.
The logic behind the indicator is that stocks that opens substantially lower than yesterdays close, very often bounces back during the day and closes higher than the open price, thus the name Intraday Mean reversal. The stock so to speak, reverses to the mean.
The indicator has 7 levels to choose from:
0.5 * standard deviation
0.6 * standard deviation
0.7 * standard deviation
0.8 * standard deviation
0.9 * standard deviation
1.0 * standard deviation
1.1 * standard deviation
The script can easily be modified to test other levels as well, but according to my experience these levels work the best.
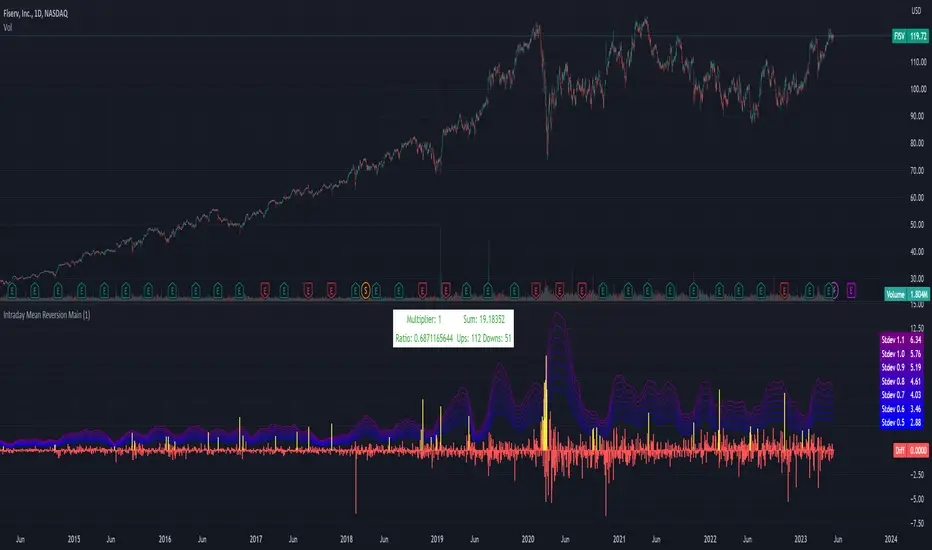
The info box shows the performance of one of these levels, chosen by the user.
Every Yellow bar in the graph shows a buy signal. That is: The stocks open is substantially lower (0.5 - 1.1 standard deviations) than yesterdays close. This means we have a buy signal.
The Multiplier shows which multiplier is chosen, the sum shows the profit following the strategy if ONE stock is bought on every buy signal. The Ratio shows the ratio between winning and losing trades if we followed the strategy historically.
We want to find stocks that have a high ratio and a positive sum. That is More Ups than downs. A ratio over 0.5 is good, but of course we want a margin of safety so, 0.75 is a better choice but harder to find.
If we find a stock that meets our criteria then the strategy will be to buy as early as possible on the open, and sell as close as possible on the close!
The logic behind the indicator is that stocks that opens substantially lower than yesterdays close, very often bounces back during the day and closes higher than the open price, thus the name Intraday Mean reversal. The stock so to speak, reverses to the mean.
The indicator has 7 levels to choose from:
0.5 * standard deviation
0.6 * standard deviation
0.7 * standard deviation
0.8 * standard deviation
0.9 * standard deviation
1.0 * standard deviation
1.1 * standard deviation
The script can easily be modified to test other levels as well, but according to my experience these levels work the best.
The info box shows the performance of one of these levels, chosen by the user.
Every Yellow bar in the graph shows a buy signal. That is: The stocks open is substantially lower (0.5 - 1.1 standard deviations) than yesterdays close. This means we have a buy signal.
The Multiplier shows which multiplier is chosen, the sum shows the profit following the strategy if ONE stock is bought on every buy signal. The Ratio shows the ratio between winning and losing trades if we followed the strategy historically.
We want to find stocks that have a high ratio and a positive sum. That is More Ups than downs. A ratio over 0.5 is good, but of course we want a margin of safety so, 0.75 is a better choice but harder to find.
If we find a stock that meets our criteria then the strategy will be to buy as early as possible on the open, and sell as close as possible on the close!
Skrip sumber terbuka
Dalam semangat TradingView sebenar, pencipta skrip ini telah menjadikannya sumber terbuka, jadi pedagang boleh menilai dan mengesahkan kefungsiannya. Terima kasih kepada penulis! Walaupuan anda boleh menggunakan secara percuma, ingat bahawa penerbitan semula kod ini tertakluk kepada Peraturan Dalaman.
Penafian
Maklumat dan penerbitan adalah tidak bertujuan, dan tidak membentuk, nasihat atau cadangan kewangan, pelaburan, dagangan atau jenis lain yang diberikan atau disahkan oleh TradingView. Baca lebih dalam Terma Penggunaan.