OPEN-SOURCE SCRIPT
open close time trend
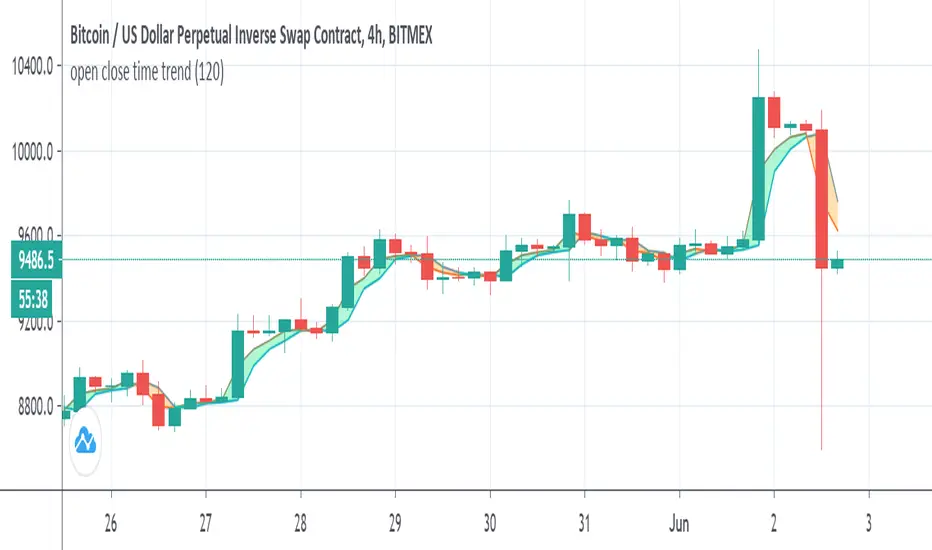
So this indicator show the relation between open and close acording to time length
why it intresting? since the distance is realtion of min compare to the regular way we calculate the distance. in this way we can see how open and close state are related. in this indicator when close above open it buy signal seen as lime and vice versa seen as orange. since the distance is in min we can set the min to be above the chart that we use or to see the distance in min bellow the chart time frame that we use . as in this example it set to 120 min on 4 hour chart. you can go even lower to 60 min on 4 hour chart . this reduce the lag that normaly we have with our indicator. on the other hand we can set it above the time frame that we use in order to see longer trend.
i put signal as options for the crossing of the close and open
there is no repaint here
Skrip sumber terbuka
Dalam semangat TradingView sebenar, pencipta skrip ini telah menjadikannya sumber terbuka, jadi pedagang boleh menilai dan mengesahkan kefungsiannya. Terima kasih kepada penulis! Walaupuan anda boleh menggunakan secara percuma, ingat bahawa penerbitan semula kod ini tertakluk kepada Peraturan Dalaman.
Penafian
Maklumat dan penerbitan adalah tidak bertujuan, dan tidak membentuk, nasihat atau cadangan kewangan, pelaburan, dagangan atau jenis lain yang diberikan atau disahkan oleh TradingView. Baca lebih dalam Terma Penggunaan.