PROTECTED SOURCE SCRIPT
Telah dikemas kini Liquidity Imbalance Index (Li2)
How to Use the Liquidity Imbalance Index (Li2)
The Liquidity Imbalance Index (Li2) is designed to track market liquidity and identify significant imbalances between buyers and sellers. Here's how to effectively use this indicator in your trading:
Understanding the Main Components
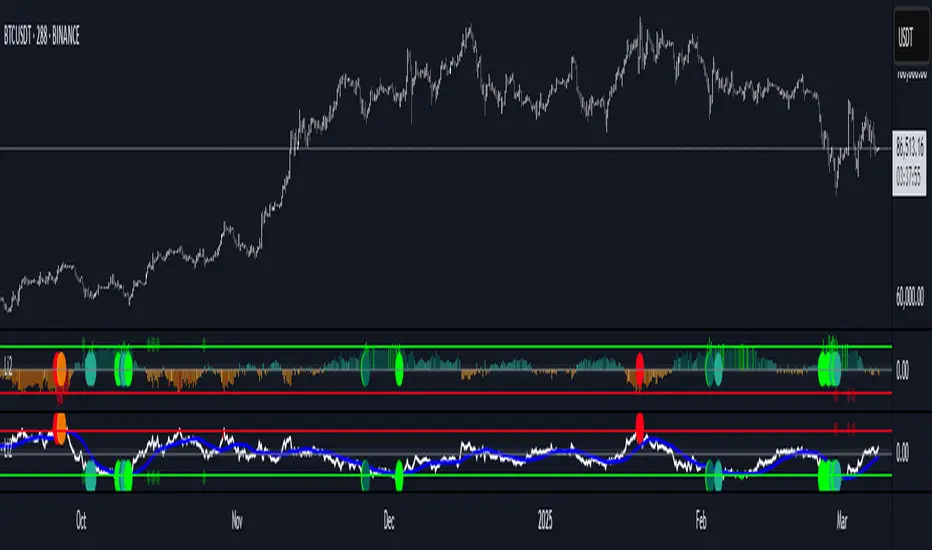
1. Liquidity Delta Histogram/Line:
- Shows the difference between buy and sell liquidity
- Green bars/line: Buying pressure dominates
- Red bars/line: Selling pressure dominates
- The intensity of color shows the strength of the imbalance
2. Threshold Lines:
- Upper (green) threshold: Marks significant buy pressure
- Lower (red) threshold: Marks significant sell pressure
- Neutral zone: Area between the dotted lines where neither buyers nor sellers dominate
3. Liquidity Zones (circles shown on top/bottom):
- Green circles on upper threshold: Historical bull zones (significant buying interest)
- Red circles on lower threshold: Historical bear zones (significant selling interest)
- These zones require multiple hits, consecutive signals, and optionally volume confirmation
Trading Strategies
For Trend Trading
1. Look for when the Liquidity Delta crosses above the upper threshold for bullish signals
2. Look for when the Liquidity Delta crosses below the lower threshold for bearish signals
3. Especially powerful when crossing occurs with acceleration (darker histogram colors)
For Support and Resistance
1. Identify where the significant bull/bear zones appear (green/red circles)
2. These often align with important price levels where orders cluster
3. Use these zones as potential reversal or confirmation points
For Divergence
1. Watch for price making new highs/lows while liquidity shows the opposite
2. Divergence between price and liquidity can signal potential reversals
Volume Confirmation
1. Pay attention to volume-confirmed signals (small circles at zero line)
2. These indicate stronger conviction behind the liquidity imbalance
Optimal Settings
- For day trading or volatile markets, consider reducing lookback periods and increasing thresholds
- For swing trading, the default settings work well to capture significant zones
- In ranging markets, focus on the zones as they often mark the range boundaries
- In trending markets, follow the overall direction of the liquidity delta
Reading Acceleration Signals
The indicator shows color intensity variations to highlight acceleration in liquidity flows:
- Dark green/red: Strong acceleration (rapid shift in order flow)
- Medium green/red: Medium acceleration
- Light green/red: Weak acceleration
These acceleration signals often precede significant price movements.
The Liquidity Imbalance Index (Li2) is designed to track market liquidity and identify significant imbalances between buyers and sellers. Here's how to effectively use this indicator in your trading:
Understanding the Main Components
1. Liquidity Delta Histogram/Line:
- Shows the difference between buy and sell liquidity
- Green bars/line: Buying pressure dominates
- Red bars/line: Selling pressure dominates
- The intensity of color shows the strength of the imbalance
2. Threshold Lines:
- Upper (green) threshold: Marks significant buy pressure
- Lower (red) threshold: Marks significant sell pressure
- Neutral zone: Area between the dotted lines where neither buyers nor sellers dominate
3. Liquidity Zones (circles shown on top/bottom):
- Green circles on upper threshold: Historical bull zones (significant buying interest)
- Red circles on lower threshold: Historical bear zones (significant selling interest)
- These zones require multiple hits, consecutive signals, and optionally volume confirmation
Trading Strategies
For Trend Trading
1. Look for when the Liquidity Delta crosses above the upper threshold for bullish signals
2. Look for when the Liquidity Delta crosses below the lower threshold for bearish signals
3. Especially powerful when crossing occurs with acceleration (darker histogram colors)
For Support and Resistance
1. Identify where the significant bull/bear zones appear (green/red circles)
2. These often align with important price levels where orders cluster
3. Use these zones as potential reversal or confirmation points
For Divergence
1. Watch for price making new highs/lows while liquidity shows the opposite
2. Divergence between price and liquidity can signal potential reversals
Volume Confirmation
1. Pay attention to volume-confirmed signals (small circles at zero line)
2. These indicate stronger conviction behind the liquidity imbalance
Optimal Settings
- For day trading or volatile markets, consider reducing lookback periods and increasing thresholds
- For swing trading, the default settings work well to capture significant zones
- In ranging markets, focus on the zones as they often mark the range boundaries
- In trending markets, follow the overall direction of the liquidity delta
Reading Acceleration Signals
The indicator shows color intensity variations to highlight acceleration in liquidity flows:
- Dark green/red: Strong acceleration (rapid shift in order flow)
- Medium green/red: Medium acceleration
- Light green/red: Weak acceleration
These acceleration signals often precede significant price movements.
Nota Keluaran
Added new view of delta line when "Show Histogram" is not checkedAdded option for additional moving average when "Show Histogram" is not checked
Nota Keluaran
- Added reversal markers using arrows- Added RSI and OI analysis components for detecting reversals
- Streamlined user interface by removing many input parameters
- Changed liquidity zone style from circles to stepline_diamond
- Added ability to show different sized markers based on signal strength
- Added the reversal marker logic
- Added distinction between weak and strong reversal signals
- Added tracking of consecutive confirmation for bullish signals
- Added pre-calculation of values to ensure consistent historical calculations
- Organized the code with section headers
- Changed to display reversal markers regardless of OI line display setting
Skrip dilindungi
Skrip ini diterbitkan sebagai sumber tertutup. Akan tetapi, anda boleh menggunakannya secara bebas dan tanpa apa-apa had – ketahui lebih di sini.
Penafian
Maklumat dan penerbitan adalah tidak bertujuan, dan tidak membentuk, nasihat atau cadangan kewangan, pelaburan, dagangan atau jenis lain yang diberikan atau disahkan oleh TradingView. Baca lebih dalam Terma Penggunaan.