OPEN-SOURCE SCRIPT
Telah dikemas kini Auto-Support
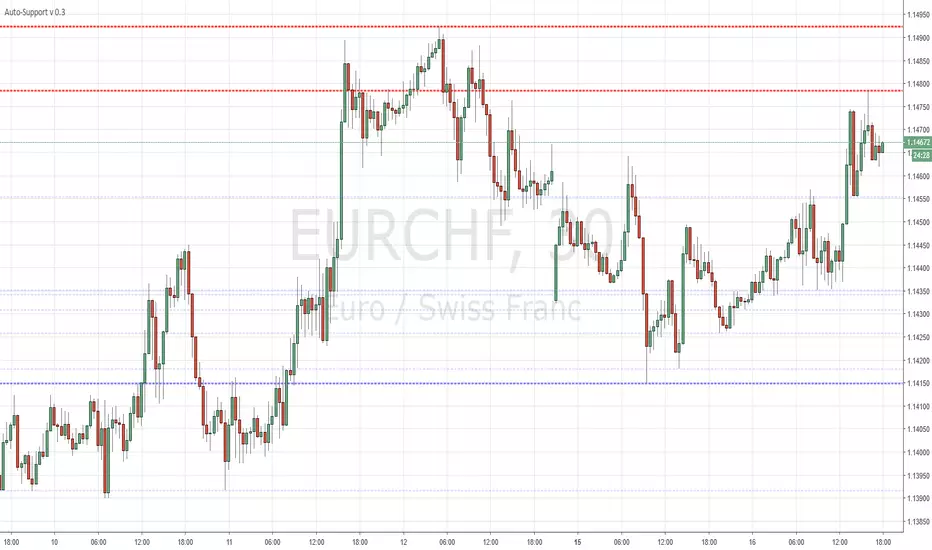
Fairly simple script that automatically draws highs and lows for the past X periods at various intervals.
3 Settings :
"Sensitivity" which amounts to the horizontal separation from one high to the next high (default multiplicator : 10)
Variable "b" which is the HEX color for resistances (default : red)
Variable "c" which is the HEX color for supports (default : blue)
More HEX color codes on hexcolortool.com/ (not my webpage :)
Feel free to edit the script to your taste.
Nota Keluaran
*** Bug Fix version after today's error message issues ****Anyone using previous versions is strongly advised to update
> Removed some higher s/r levels from the code
> Sensitivity can now only be set between 1 - 10, higher numbers cause the script to fail to load
***********************************************************************
Fairly simple script that automatically draws highs and lows for the past X periods at various intervals.
3 Settings :
"Sensitivity" which amounts to the horizontal separation from one high to the next high (default multiplicator : 10)
"Transparency" ... Multiple lines piling up at the same level will cause the s/r levels to be more or less visible.
Variable "b" which is the HEX color for resistances (default : red)
Variable "c" which is the HEX color for supports (default : blue)
More HEX color codes on hexcolortool.com/ (not my webpage :)
Feel free to edit the script to your taste.
Skrip sumber terbuka
Dalam semangat TradingView sebenar, pencipta skrip ini telah menjadikannya sumber terbuka, jadi pedagang boleh menilai dan mengesahkan kefungsiannya. Terima kasih kepada penulis! Walaupuan anda boleh menggunakan secara percuma, ingat bahawa penerbitan semula kod ini tertakluk kepada Peraturan Dalaman.
Penafian
Maklumat dan penerbitan adalah tidak bertujuan, dan tidak membentuk, nasihat atau cadangan kewangan, pelaburan, dagangan atau jenis lain yang diberikan atau disahkan oleh TradingView. Baca lebih dalam Terma Penggunaan.