PROTECTED SOURCE SCRIPT
Fibonacci Averages Oscillator M.Ataoglu
============================================================================
FIBONACCI AVERAGES OSCILLATOR - TRADINGVIEW DESCRIPTION
============================================================================
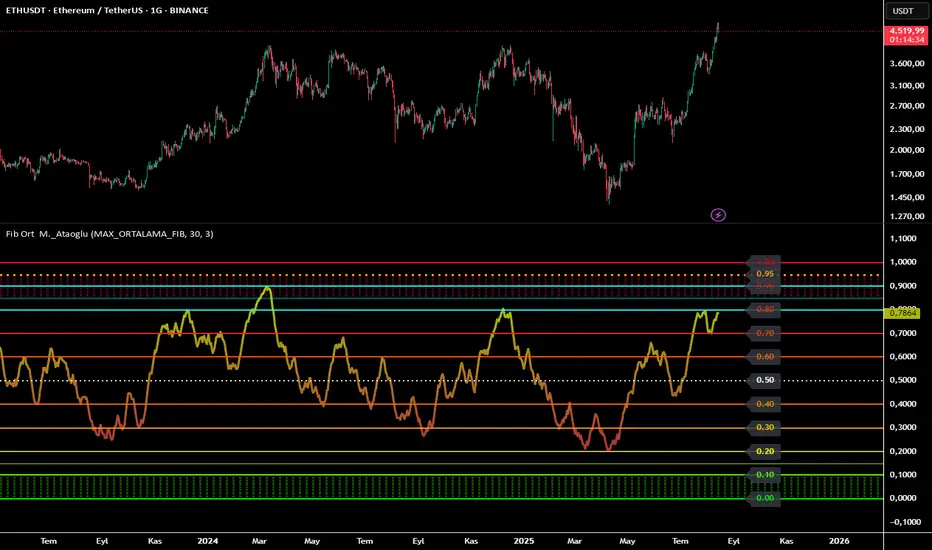
📊 Fibonacci Averages Oscillator - Advanced Trend Analysis Tool
This indicator provides comprehensive trend analysis by combining multiple Fibonacci sequence periods into a single oscillator. It calculates trend strength using the mathematical properties of Fibonacci numbers to create a powerful trend detection system.
🔬 HOW IT WORKS:
The indicator uses a sophisticated algorithm that:
• Calculates moving averages for each Fibonacci period individually
• Combines all periods using weighted averaging techniques
• Normalizes the result to a 0-1 scale for easy interpretation
• Applies smoothing algorithms to reduce market noise
• Provides real-time color gradient visualization
📈 KEY FEATURES:
• MAX_ORTALAMA_FIB Mode: Uses average of all 11 Fibonacci periods (recommended)
• Individual Period Selection: Choose specific Fibonacci numbers
• Adaptive Smoothing: Adjustable smoothing parameter (2-70)
• Color Gradient System: Red (bearish) to Green (bullish) progression
• Detailed Level Lines: Precise support/resistance identification
• Neon Cyan Highlights: Special emphasis on key levels
• Performance Optimized: Advanced caching system for smooth operation
🎯 USAGE GUIDE:
• Values above 0.5: Bullish trend strength
• Values below 0.5: Bearish trend strength
• Color changes: Real-time trend strength progression
• Level lines: Key support/resistance identification
• Neon cyan levels: Critical decision points
⚙️ TECHNICAL SPECIFICATIONS:
• Calculation Method: Fibonacci-weighted moving averages
• Timeframe Compatibility: All timeframes (M1 to Monthly)
• Market Compatibility: Forex, Stocks, Crypto, Commodities
• Performance: Optimized for real-time trading
🔧 PARAMETERS:
• Max Fibonacci Number: Select calculation period or use MAX_ORTALAMA_FIB
• Smoothing Level: Adjust trend line smoothness (2-70)
• Trend Color (Low): Customize bearish trend color
• Trend Color (High): Customize bullish trend color
• Trend Line Thickness: Adjust line visibility (1-10)
⚠️ RISK DISCLAIMER:
This indicator is for educational and analysis purposes only. It does not constitute investment advice. Always conduct your own research and consider multiple factors before making trading decisions. Past performance does not guarantee future results.
🔗 CREDITS:
• Fibonacci calculation library: tkarolak
• Developed by: M._Ataoglu
• Version: 1.0
• Pine Script Version: 6
FIBONACCI AVERAGES OSCILLATOR - TRADINGVIEW DESCRIPTION
============================================================================
📊 Fibonacci Averages Oscillator - Advanced Trend Analysis Tool
This indicator provides comprehensive trend analysis by combining multiple Fibonacci sequence periods into a single oscillator. It calculates trend strength using the mathematical properties of Fibonacci numbers to create a powerful trend detection system.
🔬 HOW IT WORKS:
The indicator uses a sophisticated algorithm that:
• Calculates moving averages for each Fibonacci period individually
• Combines all periods using weighted averaging techniques
• Normalizes the result to a 0-1 scale for easy interpretation
• Applies smoothing algorithms to reduce market noise
• Provides real-time color gradient visualization
📈 KEY FEATURES:
• MAX_ORTALAMA_FIB Mode: Uses average of all 11 Fibonacci periods (recommended)
• Individual Period Selection: Choose specific Fibonacci numbers
• Adaptive Smoothing: Adjustable smoothing parameter (2-70)
• Color Gradient System: Red (bearish) to Green (bullish) progression
• Detailed Level Lines: Precise support/resistance identification
• Neon Cyan Highlights: Special emphasis on key levels
• Performance Optimized: Advanced caching system for smooth operation
🎯 USAGE GUIDE:
• Values above 0.5: Bullish trend strength
• Values below 0.5: Bearish trend strength
• Color changes: Real-time trend strength progression
• Level lines: Key support/resistance identification
• Neon cyan levels: Critical decision points
⚙️ TECHNICAL SPECIFICATIONS:
• Calculation Method: Fibonacci-weighted moving averages
• Timeframe Compatibility: All timeframes (M1 to Monthly)
• Market Compatibility: Forex, Stocks, Crypto, Commodities
• Performance: Optimized for real-time trading
🔧 PARAMETERS:
• Max Fibonacci Number: Select calculation period or use MAX_ORTALAMA_FIB
• Smoothing Level: Adjust trend line smoothness (2-70)
• Trend Color (Low): Customize bearish trend color
• Trend Color (High): Customize bullish trend color
• Trend Line Thickness: Adjust line visibility (1-10)
⚠️ RISK DISCLAIMER:
This indicator is for educational and analysis purposes only. It does not constitute investment advice. Always conduct your own research and consider multiple factors before making trading decisions. Past performance does not guarantee future results.
🔗 CREDITS:
• Fibonacci calculation library: tkarolak
• Developed by: M._Ataoglu
• Version: 1.0
• Pine Script Version: 6
Skrip dilindungi
Skrip ini diterbitkan sebagai sumber tertutup. Akan tetapi, anda boleh menggunakannya secara bebas dan tanpa apa-apa had – ketahui lebih di sini.
Penafian
Maklumat dan penerbitan adalah tidak bertujuan, dan tidak membentuk, nasihat atau cadangan kewangan, pelaburan, dagangan atau jenis lain yang diberikan atau disahkan oleh TradingView. Baca lebih dalam Terma Penggunaan.