OPEN-SOURCE SCRIPT
Telah dikemas kini Comparative Relative Strength of a stock
Perform comparative relative strength of a stock. Default base is NIFTY 50.
Nota Keluaran
Cosmetic changes to make the display pretty and input choices in more logical sequence.Nota Keluaran
Added input as source. Some cosmetic changes.Nota Keluaran
- version 5
- Added color code for CRS moving average
A color-based trend on the Ratio moving average. The trend lookback is configurable.
Nota Keluaran
- Possible to plot candles, of ratio chart, instead of line chart only.
Nota Keluaran
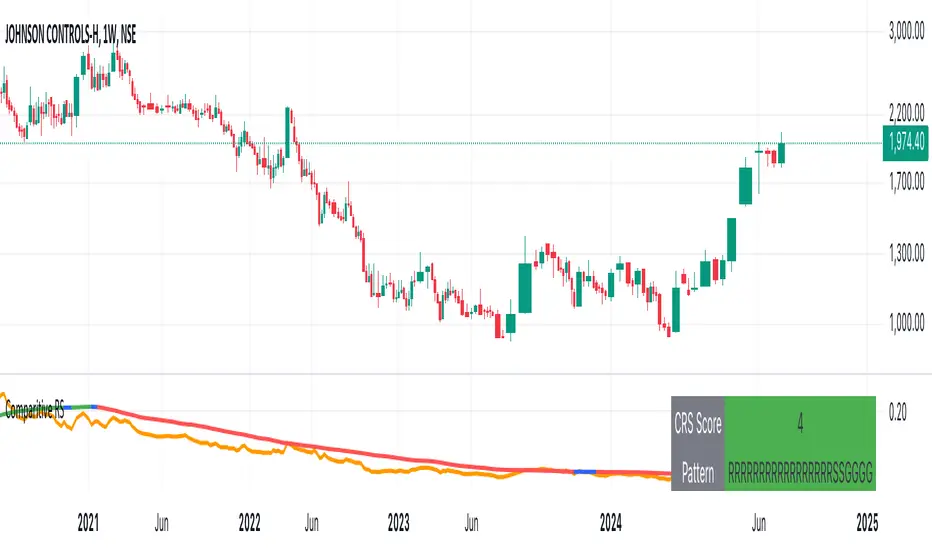
Updated to include a "CRS Score" and "CRS Pattern"- CRS Score: The number of consecutive bars, when the trend of the relative strength is increasing/decreasing. If CRS is falling, score will be negative, if rising, score will be positive and 0 if it is neither positive nor negative (blue)
- CRS Pattern: The pattern of the last 23 (default) bars for the CRS Trend.
If say, the CRS Pattern is RRRRRRRRRSSGG - It means that after 11 bars, the strength is now positive for last 2 bars. This is a good way to visualise a turn around in relative strength of the stock. Higher the number of opposite trend the greater that chance of the reversal.
Skrip sumber terbuka
Dalam semangat TradingView sebenar, pencipta skrip ini telah menjadikannya sumber terbuka, jadi pedagang boleh menilai dan mengesahkan kefungsiannya. Terima kasih kepada penulis! Walaupuan anda boleh menggunakan secara percuma, ingat bahawa penerbitan semula kod ini tertakluk kepada Peraturan Dalaman.
Penafian
Maklumat dan penerbitan adalah tidak bertujuan, dan tidak membentuk, nasihat atau cadangan kewangan, pelaburan, dagangan atau jenis lain yang diberikan atau disahkan oleh TradingView. Baca lebih dalam Terma Penggunaan.