(CF|360) Caruso Financial Dashboard
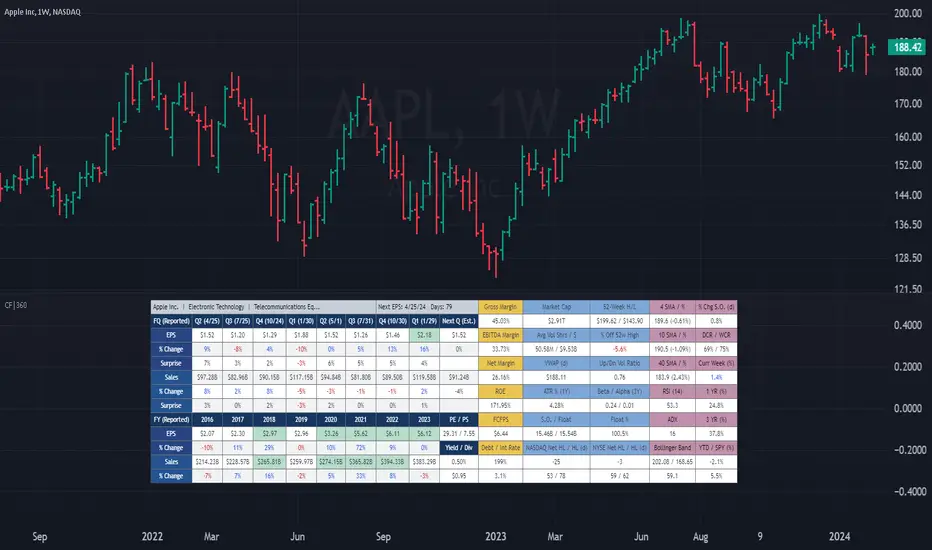
The dashboard is strategically divided into five distinct sections, each color-coded for user-friendly navigation. A quick glance at the dark blue "Fundamentals" table reveals two years of quarterly EPS and Sales data, YoY % change, and Surprise %, complete with report dates. Users can explore eight years of annual data and choose between Non-GAAP EPS, Diluted EPS, and Basic EPS for versatile analysis. Opting for Non-GAAP EPS also unveils next quarter estimates. The Fundamentals section further encompasses P/E and P/S data, alongside TTM dividend and dividend yield information.
In the yellow "Extended Fundamentals" section, users gain insights into Gross, EBITDA, and Net margins for easy profitability comparisons within the same industry group. Return on Equity data and Free Cashflow per share provide perspectives on profitability, efficiency, and financial flexibility.
The light blue "Statistics" section furnishes essential statistical measures for a rapid grasp of a company's trading characteristics. Metrics such as Market Cap, Average Volume per day (Shares and $ value), VWAP, Up/Down volume ratio, ATR%, Alpha, Beta, Shares Outstanding & Float, 52-week High/Low, and % distance from the 52-week high are presented. Additionally, market breadth is depicted through Nasdaq and NYSE 52-week high/low data.
The purple "Technical & Performance" section seamlessly integrates both Technical Analysis data and Performance statistics, enabling users to assess the stock's technical context and performance against the market over different periods. Technical indicators, including three customizable moving average types, RSI, ADX, Bollinger Band, Keltner Band, and daily and weekly closing ranges, are featured.
The grey top "Events" section offers a quick overview of the next earnings release date, countdown, and associated color changes as the date approaches. Company name, sector, and industry details are also presented.
To enhance information visibility, record EPS and Sales data are highlighted, emphasizing new records, along with highlights for new 52-week highs and lows.
The CF|360 offers customization options, including three display styles for Desktops, Desktop Slim, and Mobile devices.
Users can also tailor the lengths of technical indicators to suit their preferences. International market enthusiasts will appreciate that the CF|360 provides financial and market data for various regions, including the US, EU, Canada, and beyond.
88 Metrics Included:
Fundamentals Section (Dark Blue Group)
EPS (Adjusted Non-GAAP, Diluted, Basic)
- Quarterly, YoY % Chg, Surprise, Report Date, Next Quarter Estimate (Adjusted EPS only)
- Annual, YoY % Chg
Sales
- Quarterly, YoY % Chg, Surprise, Report Date, Next Quarter Estimate
- Annual, YoY % Chg
P/E ratio
P/S ratio
Dividend TTM
Dividend TTM Yield
Fundamentals Extended (Yellow Group)
Gross Margin [TTM]
EBITDA Margin [TTM]
Net Margin [TTM]
Return on Equity (ROE) [FY]
Free Cashflow per Share (FCFPS) [TTM]
Debt to Equity (Debt) [FQ]
Effective Interest Rate (Int Rate) [FQ]
Statistics (Light Blue Group)
Market Cap
Average Daily Volume (Shares)
Average Daily Volume (Dollar Value)
VWAP (Daily)
Average True Range Percent
Shares Outstanding
Shares in Float
Percentage of Share in Float
52-Week High
52-Week Low
% off of 52-Week High
Up / Down Volume Ratio
Beta
Alpha
Nasdaq Net 52-Week High/Lows
Nasdaq 52-Week Highs
Nasdaq 52-Week Lows
NYSE Net 52-Week High/Lows
NYSE 52-Week Highs
NYSE 52-Week Lows
Technical & Performance (Purple Group)
Moving Average Value (3 different averages)
Distance from Moving Average (3 different averages)
Relative Strength Index (RSI)
Average Directional Index (ADX)
Bollinger Band Value (Upper/Lower)
%b
Keltner Band Value (Upper/Lower)
%k
Percentage Changes Since Today’s Open
Daily Closing Range (DCR)
Weekly Closing Range (WCR)
Current Week % Change
1 Month % Change
3 Month % Change
6 Month % Change
1 Year % Change
3 Year % Change
YTD % Change
S&P 500 YTD % Change
Name, Group, & Events (Grey Section)
Company Name
Sector
Industry
Next Earnings Date
Days Until Next Earnings Date
Event Highlights
Record EPS (Quarterly/Annual) [Green]
Record Sales (Quarterly/Annual) [Green]
52-Week High [Green]
52-Week Low [Red]
Layout Types
Desktop
Get the full experience with the Desktop view.
Desktop Slim
Save screen real estate with a slim version of the dashboard.
Mobile
Take the most vital metrics with you on your mobile device. For the best experience, view in landscape mode.
- Minor bug fixes.
Skrip jemputan sahaja
Hanya pengguna disahkan oleh penulis boleh mengakses skrip ini. Anda perlu memohon dan mendapatkan kebenaran untuk menggunakannya. Keizinan selalunya diberikan selepas pembayaran. Untuk lebih butiran, ikuti arahan penulis di bawah atau hubungi CarusoInsights secara terus.
TradingView TIDAK menyarankan pembayaran atau penggunaan skrip kecuali anda mempercayai sepenuhnya penulis dan memahami bagaimana ia berfungsi. Anda juga boleh menjumpai alternatif sumber terbuka dan percuma yang lain di dalam skrip komuniti kami.
Arahan penulis
Penafian
Skrip jemputan sahaja
Hanya pengguna disahkan oleh penulis boleh mengakses skrip ini. Anda perlu memohon dan mendapatkan kebenaran untuk menggunakannya. Keizinan selalunya diberikan selepas pembayaran. Untuk lebih butiran, ikuti arahan penulis di bawah atau hubungi CarusoInsights secara terus.
TradingView TIDAK menyarankan pembayaran atau penggunaan skrip kecuali anda mempercayai sepenuhnya penulis dan memahami bagaimana ia berfungsi. Anda juga boleh menjumpai alternatif sumber terbuka dan percuma yang lain di dalam skrip komuniti kami.