PROTECTED SOURCE SCRIPT
Vwapbot (VWAP + Ut Bot Alerts)
Vwapbot (VWAP + Ut Bot Alerts) - Complete Guide
This Pine Script indicator combines two powerful trading tools: Volume Weighted Average Price (VWAP) and the UT Bot trend-following system. Here's a comprehensive breakdown:
What This Indicator Does
The indicator provides:
1. VWAP calculation with deviation bands
2. UT Bot trend signals with trailing stops
3. Combined confluence alerts when both indicators align
4. Visual information table showing current market conditions
Core Components
1. VWAP (Volume Weighted Average Price)
What it is: VWAP calculates the average price weighted by volume, giving more importance to high-volume periods.
Settings:
• VWAP Source: Price used for calculation (default: hlc3 - average of high, low, close)
• VWAP Anchor: Reset period (Session/Week/Month/Quarter/Year)
Usage:
• Price above VWAP = bullish bias
• Price below VWAP = bearish bias
• VWAP acts as dynamic support/resistance
2. VWAP Deviation Bands
What they show: Statistical boundaries around VWAP based on price volatility
Settings:
• Standard Deviation Multiplier: How far the bands extend (default: 1.0)
• Show Bands: Toggle visibility
Usage:
• Gray dashed lines: 1 standard deviation bands (normal price range)
• Red dotted lines: 2 standard deviation bands (extreme price levels)
• Price touching outer bands may indicate reversal opportunities
3. UT Bot (Ultimate Trend Bot)
What it does: Creates a trailing stop system that follows trends and signals reversals
Settings:
• Key Value: Sensitivity multiplier (1.0 = balanced, lower = more sensitive)
• ATR Period: Lookback period for volatility calculation (default: 10)
How it works:
• Uses ATR (Average True Range) to calculate dynamic support/resistance levels
• Green line = uptrend (trailing stop below price)
• Red line = downtrend (trailing stop above price)
4. UT Bot Alerts are integrated to the logic of Volume Profile i,e VWAP, the UT Bot Stop trailing line plot its data and change trends obtaining it's logic from the VWAP and Standard Deviation bands, thus it differs in it's logic of UT Bot alerts from other indicators.
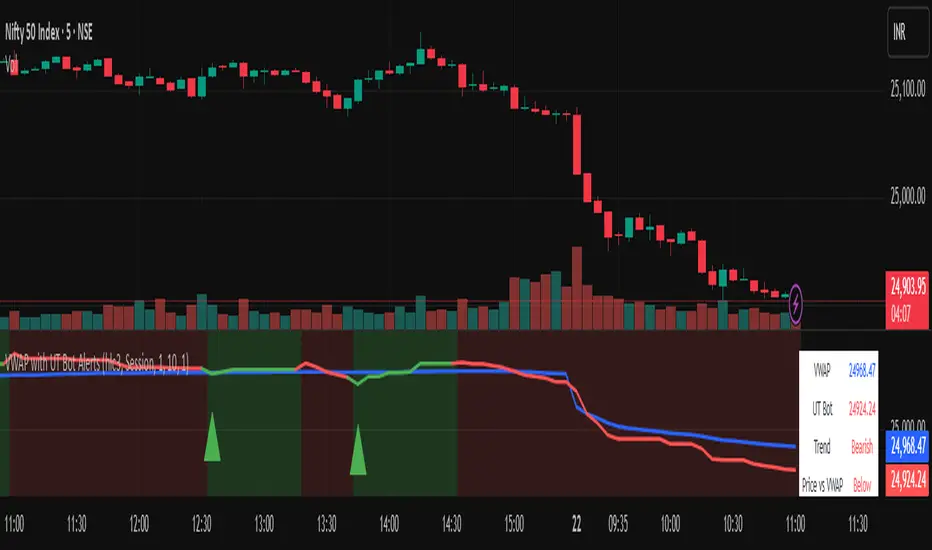
Visual Elements
On-Chart Displays:
1. Blue line: VWAP
2. Gray lines: 1st deviation bands
3. Red lines: 2nd deviation bands
4. Green/Red thick line: UT Bot trailing stop
5. Green triangles up: Buy signals
6. Red triangles down: Sell signals
7. Background color: Light green (bullish) / Light red (bearish)
Information Table (Top Right):
• VWAP: Current VWAP value
• UT Bot: Current trailing stop level
• Trend: Bullish/Bearish status
• Price vs VWAP: Above/Below comparison
• Deviation: Percentage distance from VWAP
• Volume: Current bar volume
Trading Signals
Basic Signals:
1. UT Bot Buy: Green triangle when trend turns bullish
2. UT Bot Sell: Red triangle when trend turns bearish
3. VWAP Cross Above: Price crosses above VWAP
4. VWAP Cross Below: Price crosses below VWAP
Confluence Signals :
1. Bullish Confluence: UT Bot buy signal + Price above VWAP
2. Bearish Confluence: UT Bot sell signal + Price below VWAP
How to Use This Indicator
For Trend Following:
1. Enter long when you get a bullish confluence signal
2. Enter short when you get a bearish confluence signal
3. Exit when the UT Bot trend changes color
For Mean Reversion:
1. Look for reversals when price hits the 2nd deviation bands
2. Confirm with UT Bot signals
3. Target return to VWAP
For Support/Resistance:
1. Use VWAP as dynamic support in uptrends, resistance in downtrends
2. Watch for bounces at deviation bands
3. Confirm direction with UT Bot trend color
Best Practices
Timeframes:
• Intraday: Use Session VWAP anchor
• Swing trading: Use Weekly/Monthly anchors
• Position trading: Use Monthly/Quarterly anchors
Risk Management:
• Stop loss: Below/above the UT Bot trailing stop
• Position sizing: Smaller positions when price is at extreme deviation bands
• Confluence: Wait for both VWAP and UT Bot alignment for strongest signals
Market Conditions:
• Trending markets: Focus on UT Bot signals and VWAP direction bias
• Ranging markets: Use deviation bands for entry/exit points
• High volume periods: VWAP becomes more significant
Alert System
The indicator provides 6 types of alerts:
1. UT Bot buy/sell signals
2. VWAP crossover alerts
3. Confluence alerts (most important)
Set up alerts for confluence signals to catch the highest probability setups when both indicators align.
This indicator works best when combined with proper risk management and used in conjunction with market structure analysis. The confluence signals provide the highest probability entries, while the individual components help with market.
[*Tip: This indicator works best with 5M(5minutes) candlestick pattern.]
Advice from the publisher:
For using with Indices e.g NIFTY 50, BANKNIFTY etc. use parameters:
UT BOT Key Value : 1
UT BOT ATR Period : 10
Standard Deviation Multiplier : 1 {Default}
For using with commodities e.g NATURALGAS, CRUDEOIL etc. use parameters:
UT BOT Key Value : 2
UT BOT ATR Period : 7
Standard Deviation Multiplier : 1 {Default}
This Pine Script indicator combines two powerful trading tools: Volume Weighted Average Price (VWAP) and the UT Bot trend-following system. Here's a comprehensive breakdown:
What This Indicator Does
The indicator provides:
1. VWAP calculation with deviation bands
2. UT Bot trend signals with trailing stops
3. Combined confluence alerts when both indicators align
4. Visual information table showing current market conditions
Core Components
1. VWAP (Volume Weighted Average Price)
What it is: VWAP calculates the average price weighted by volume, giving more importance to high-volume periods.
Settings:
• VWAP Source: Price used for calculation (default: hlc3 - average of high, low, close)
• VWAP Anchor: Reset period (Session/Week/Month/Quarter/Year)
Usage:
• Price above VWAP = bullish bias
• Price below VWAP = bearish bias
• VWAP acts as dynamic support/resistance
2. VWAP Deviation Bands
What they show: Statistical boundaries around VWAP based on price volatility
Settings:
• Standard Deviation Multiplier: How far the bands extend (default: 1.0)
• Show Bands: Toggle visibility
Usage:
• Gray dashed lines: 1 standard deviation bands (normal price range)
• Red dotted lines: 2 standard deviation bands (extreme price levels)
• Price touching outer bands may indicate reversal opportunities
3. UT Bot (Ultimate Trend Bot)
What it does: Creates a trailing stop system that follows trends and signals reversals
Settings:
• Key Value: Sensitivity multiplier (1.0 = balanced, lower = more sensitive)
• ATR Period: Lookback period for volatility calculation (default: 10)
How it works:
• Uses ATR (Average True Range) to calculate dynamic support/resistance levels
• Green line = uptrend (trailing stop below price)
• Red line = downtrend (trailing stop above price)
4. UT Bot Alerts are integrated to the logic of Volume Profile i,e VWAP, the UT Bot Stop trailing line plot its data and change trends obtaining it's logic from the VWAP and Standard Deviation bands, thus it differs in it's logic of UT Bot alerts from other indicators.
Visual Elements
On-Chart Displays:
1. Blue line: VWAP
2. Gray lines: 1st deviation bands
3. Red lines: 2nd deviation bands
4. Green/Red thick line: UT Bot trailing stop
5. Green triangles up: Buy signals
6. Red triangles down: Sell signals
7. Background color: Light green (bullish) / Light red (bearish)
Information Table (Top Right):
• VWAP: Current VWAP value
• UT Bot: Current trailing stop level
• Trend: Bullish/Bearish status
• Price vs VWAP: Above/Below comparison
• Deviation: Percentage distance from VWAP
• Volume: Current bar volume
Trading Signals
Basic Signals:
1. UT Bot Buy: Green triangle when trend turns bullish
2. UT Bot Sell: Red triangle when trend turns bearish
3. VWAP Cross Above: Price crosses above VWAP
4. VWAP Cross Below: Price crosses below VWAP
Confluence Signals :
1. Bullish Confluence: UT Bot buy signal + Price above VWAP
2. Bearish Confluence: UT Bot sell signal + Price below VWAP
How to Use This Indicator
For Trend Following:
1. Enter long when you get a bullish confluence signal
2. Enter short when you get a bearish confluence signal
3. Exit when the UT Bot trend changes color
For Mean Reversion:
1. Look for reversals when price hits the 2nd deviation bands
2. Confirm with UT Bot signals
3. Target return to VWAP
For Support/Resistance:
1. Use VWAP as dynamic support in uptrends, resistance in downtrends
2. Watch for bounces at deviation bands
3. Confirm direction with UT Bot trend color
Best Practices
Timeframes:
• Intraday: Use Session VWAP anchor
• Swing trading: Use Weekly/Monthly anchors
• Position trading: Use Monthly/Quarterly anchors
Risk Management:
• Stop loss: Below/above the UT Bot trailing stop
• Position sizing: Smaller positions when price is at extreme deviation bands
• Confluence: Wait for both VWAP and UT Bot alignment for strongest signals
Market Conditions:
• Trending markets: Focus on UT Bot signals and VWAP direction bias
• Ranging markets: Use deviation bands for entry/exit points
• High volume periods: VWAP becomes more significant
Alert System
The indicator provides 6 types of alerts:
1. UT Bot buy/sell signals
2. VWAP crossover alerts
3. Confluence alerts (most important)
Set up alerts for confluence signals to catch the highest probability setups when both indicators align.
This indicator works best when combined with proper risk management and used in conjunction with market structure analysis. The confluence signals provide the highest probability entries, while the individual components help with market.
[*Tip: This indicator works best with 5M(5minutes) candlestick pattern.]
Advice from the publisher:
For using with Indices e.g NIFTY 50, BANKNIFTY etc. use parameters:
UT BOT Key Value : 1
UT BOT ATR Period : 10
Standard Deviation Multiplier : 1 {Default}
For using with commodities e.g NATURALGAS, CRUDEOIL etc. use parameters:
UT BOT Key Value : 2
UT BOT ATR Period : 7
Standard Deviation Multiplier : 1 {Default}
Skrip dilindungi
Skrip ini diterbitkan sebagai sumber tertutup. Akan tetapi, anda boleh menggunakannya secara bebas dan tanpa apa-apa had – ketahui lebih di sini.
Penafian
Maklumat dan penerbitan adalah tidak bertujuan, dan tidak membentuk, nasihat atau cadangan kewangan, pelaburan, dagangan atau jenis lain yang diberikan atau disahkan oleh TradingView. Baca lebih dalam Terma Penggunaan.