OPEN-SOURCE SCRIPT
Venit A.I Trading V1

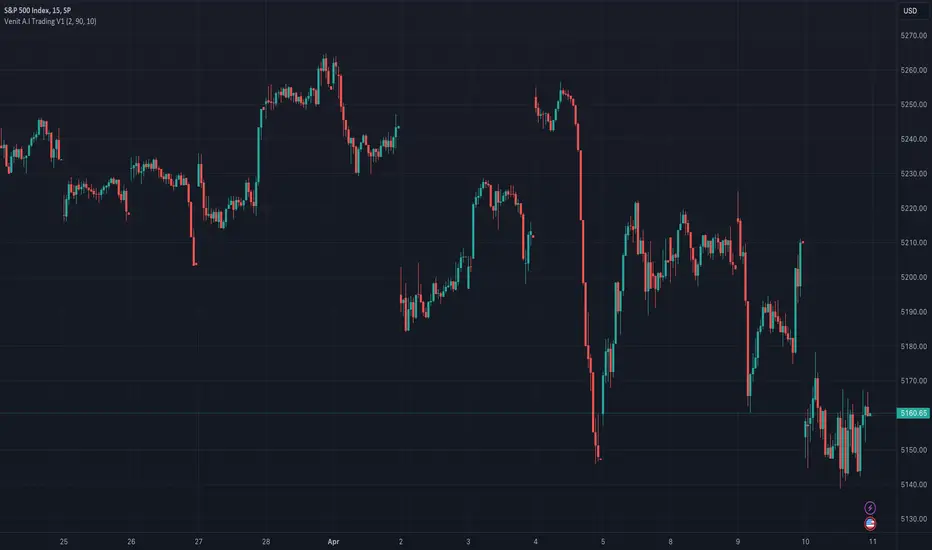
RSI indicatorThis indicator is designed to provide buy and sell signals based on the Relative Strength Index (RSI). Here's a breakdown of its components and functionality:
1. **Input Parameters**:
- `Period`: This parameter allows the user to adjust the period used in calculating the RSI.
- `Upper Threshold` and `Lower Threshold`: These parameters define the overbought and oversold levels for the RSI.
- `Imverse Algorithm`: This parameter allows the user to toggle between different algorithms for generating buy and sell signals.
- `Show Lines`: This parameter toggles the visibility of lines on the chart indicating buy and sell signals.
- `Show Labels`: This parameter toggles the visibility of labels on the chart indicating buy and sell signals.
2. **RSI Calculation**:
- The RSI is calculated using the specified period (`myPeriod`), typically representing the closing prices of the asset.
3. **Buy and Sell Conditions**:
- Buy conditions are determined based on whether the RSI crosses below the lower threshold (`myThresholdDn`), indicating potential oversold conditions.
- Sell conditions are determined based on whether the RSI crosses above the upper threshold (`myThresholdUp`), indicating potential overbought conditions.
- The choice of buy and sell conditions can be toggled using the `Imverse Algorithm` parameter.
4. **Position Tracking**:
- The indicator maintains a variable `myPosition` to track the current position (buy or sell) based on the generated signals.
- If a buy signal occurs (`buy` condition is true), `myPosition` is set to 0. If a sell signal occurs (`sell` condition is true) or the previous position was a buy, `myPosition` is set to 1. Otherwise, `myPosition` remains unchanged.
5. **Visualization**:
- Buy and sell signals are plotted on the chart using shapes (`plotshape`) based on the `myLineToggle` and `myLabelToggle` parameters.
- Lines are drawn on the chart to visually represent buy and sell signals.
- Labels are placed on the chart indicating buy and sell signals.
6. **Alerts**:
- The indicator provides alerts for buy and sell signals using the `alertcondition` function.
Overall, this indicator aims to provide traders with signals based on RSI movements, helping them identify potential buying and selling opportunities in the market. The flexibility in parameters allows users to customize the indicator based on their trading preferences and strategies.
Skrip sumber terbuka
Dalam semangat TradingView sebenar, pencipta skrip ini telah menjadikannya sumber terbuka, jadi pedagang boleh menilai dan mengesahkan kefungsiannya. Terima kasih kepada penulis! Walaupuan anda boleh menggunakan secara percuma, ingat bahawa penerbitan semula kod ini tertakluk kepada Peraturan Dalaman.
Penafian
Maklumat dan penerbitan adalah tidak bertujuan, dan tidak membentuk, nasihat atau cadangan kewangan, pelaburan, dagangan atau jenis lain yang diberikan atau disahkan oleh TradingView. Baca lebih dalam Terma Penggunaan.