OPEN-SOURCE SCRIPT
Telah dikemas kini Average hourly move by @zeusbottrading
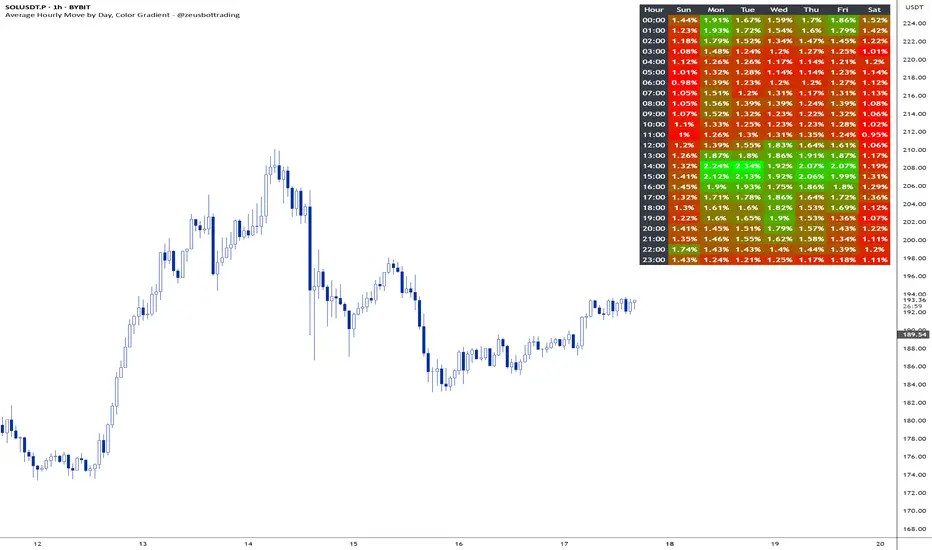
This Pine Script called "Average hourly move by zeusbottrading" calculates and displays the average percentage price movement for each hour of the day using the full available historical data.
How the script works:
It tracks the high and low price within each full hour (e.g., 10:00–10:59).
It calculates the percentage move as the range between high and low relative to the average price during that hour.
For each hour of the day, it stores the total of all recorded moves and the count of occurrences across the full history.
At the end, the script computes the average move for each hour (0 to 23) and determines the minimum and maximum averages.
Using these values, it creates a color gradient, where the hours with the lowest average volatility are red and the highest are green.
It then displays a table in the top-right corner of the chart showing each hour and its average percentage move, color‑coded according to volatility.
What it can be used for:
In short, this script is a useful tool for traders who want to fine‑tune their trading strategies and risk management by analyzing time‑based volatility profiles.
How the script works:
It tracks the high and low price within each full hour (e.g., 10:00–10:59).
It calculates the percentage move as the range between high and low relative to the average price during that hour.
For each hour of the day, it stores the total of all recorded moves and the count of occurrences across the full history.
At the end, the script computes the average move for each hour (0 to 23) and determines the minimum and maximum averages.
Using these values, it creates a color gradient, where the hours with the lowest average volatility are red and the highest are green.
It then displays a table in the top-right corner of the chart showing each hour and its average percentage move, color‑coded according to volatility.
What it can be used for:
- Identifying when the market is historically most volatile or calm during the day.
- Helping plan trade entries and exits based on expected volatility.
- Comparing hourly volatility patterns across different markets or instruments.
- Adjusting position size and risk management according to the anticipated volatility in a particular hour.
- Using long-term historical data to understand recurring daily volatility patterns.
In short, this script is a useful tool for traders who want to fine‑tune their trading strategies and risk management by analyzing time‑based volatility profiles.
Nota Keluaran
+ option to show days of the week and their hours in detailNota Keluaran
+ minor editsSkrip sumber terbuka
Dalam semangat TradingView sebenar, pencipta skrip ini telah menjadikannya sumber terbuka, jadi pedagang boleh menilai dan mengesahkan kefungsiannya. Terima kasih kepada penulis! Walaupuan anda boleh menggunakan secara percuma, ingat bahawa penerbitan semula kod ini tertakluk kepada Peraturan Dalaman.
Penafian
Maklumat dan penerbitan adalah tidak bertujuan, dan tidak membentuk, nasihat atau cadangan kewangan, pelaburan, dagangan atau jenis lain yang diberikan atau disahkan oleh TradingView. Baca lebih dalam Terma Penggunaan.
Skrip sumber terbuka
Dalam semangat TradingView sebenar, pencipta skrip ini telah menjadikannya sumber terbuka, jadi pedagang boleh menilai dan mengesahkan kefungsiannya. Terima kasih kepada penulis! Walaupuan anda boleh menggunakan secara percuma, ingat bahawa penerbitan semula kod ini tertakluk kepada Peraturan Dalaman.
Penafian
Maklumat dan penerbitan adalah tidak bertujuan, dan tidak membentuk, nasihat atau cadangan kewangan, pelaburan, dagangan atau jenis lain yang diberikan atau disahkan oleh TradingView. Baca lebih dalam Terma Penggunaan.