OPEN-SOURCE SCRIPT
Dashboard Trends
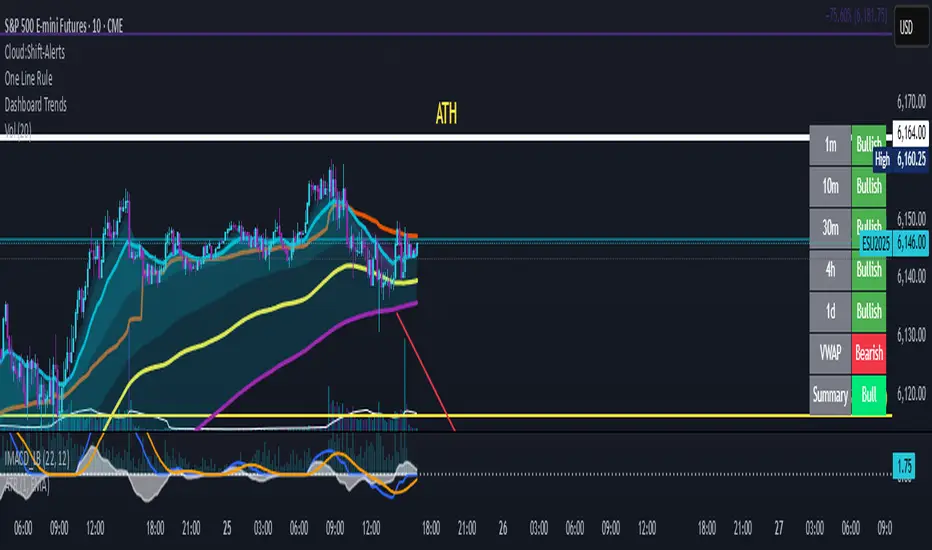
📊 Dashboard Trends + Anchored Daily VWAP
This indicator provides a real-time multi-timeframe trend dashboard alongside a daily anchored VWAP system, helping you assess both macro and intraday market sentiment at a glance.
🔍 Key Features
✅ Multi-Timeframe Trend Analysis
Tracks whether EMA(22) is above EMA(200) across:
1m, 10m, 30m, 4h, 1D timeframes
Color-coded "Bullish"/"Bearish" status for each
Aggregated trend summary using 6 signals (including VWAP)
✅ Anchored Daily VWAP
Uses ta.vwap to provide a session-resetting daily VWAP
VWAP resets at the beginning of each trading day
Live update throughout the day
Supports pre-market and after-hours if chart includes ETH
✅ VWAP Bands (±1σ to ±3σ)
Optional bands show price deviation from VWAP
Fully customizable:
Enable/disable each band
Set deviation multiplier
Adjust color and visibility
✅ Visual Dashboard
Table display in the bottom-right corner
Shows trend status per timeframe + VWAP + Summary
Easy-to-read green/yellow/red color codes
⚙️ Customization
Toggle VWAP line on/off
Enable or disable any band level
Adjust standard deviation multiplier
Choose your VWAP and band colors
🧠 Summary Logic
Strong Bull: 6 bullish signals
Bull: 5 signals
Mixed: 3–4 signals
Bear: 2 signals
Strong Bear: 0–1 signals
This tool is perfect for traders looking to combine trend-following and intraday mean-reversion awareness, with all the critical data visualized in one compact dashboard.
Skrip sumber terbuka
Dalam semangat TradingView sebenar, pencipta skrip ini telah menjadikannya sumber terbuka, jadi pedagang boleh menilai dan mengesahkan kefungsiannya. Terima kasih kepada penulis! Walaupuan anda boleh menggunakan secara percuma, ingat bahawa penerbitan semula kod ini tertakluk kepada Peraturan Dalaman.
Penafian
Maklumat dan penerbitan adalah tidak bertujuan, dan tidak membentuk, nasihat atau cadangan kewangan, pelaburan, dagangan atau jenis lain yang diberikan atau disahkan oleh TradingView. Baca lebih dalam Terma Penggunaan.