OPEN-SOURCE SCRIPT
Telah dikemas kini Opening Hour/Closing Hour Indices Statistics: high/low times; 5m

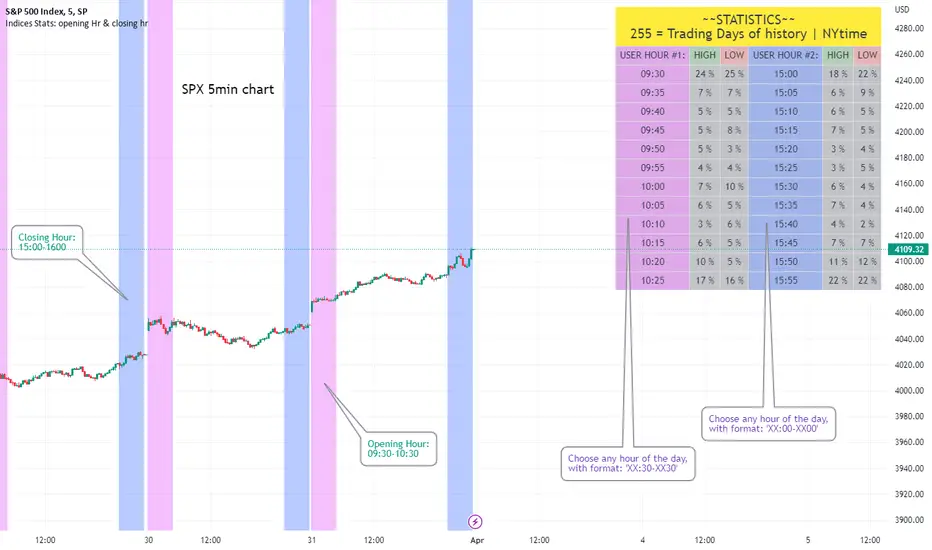
Very specific indicator designed for 5min timeframe, to show the statistical timings of the highs and lows of Opening hour (9:30-10am) and Closing hour (3pm-4pm) NY time
~~Shown here on SPX 5min chart. Works all variants of the US indices. SPX and SPY typically show more days of history (non-extended session =>> more bars).
//Purpose:
-To get statistics on the timings of the high and low of the opening hour and the high & low of the closing hour.
//Design & Limitations:
-Designed for the 5minute chart ONLY. Need a sweet spot of 'bucket' size for the statistics: to allow meaningful comparison between times.
-Will also display on 1min chart but NOT the statistics panel, only the realtime data (today's opening hour/ closing hour timings).
-Can be slow to load depending on server load at the time. This is becasue of the multiple usage of looping array functions. Please be patient when loading or changing settings.
//User inputs:
-Standard formatting options: highlight color, table text color. Toggle on/off independently
-Decimal % percision (default = 0, i.e. 23%. If set to 1 => 22.8%)
-Show statistics: Show Opening hour statistics, Show Closing hour statistics
//Notes:
-Days of history shown at top of table; this is the size of the dataset. i.e. 254 here (254 trading days) =>> 254 opening hour highs, 254 closing hour lows etc.
--to illustrate with the above: 18% of those 254 closing hour highs occured on the 15:00 5min candle (i.e. between 15:00 and 15:05).
-SPY or SPX offer the largest history/dataset (circa 254 trading days).
-Note that the final timing in each hour is 10:25am and 15:55pm respectively: this is because the 10:25am 5min candle essentially ends at 10:30am =>> we properly captures the opening hour this way
-Pro+ users will get less data history than Premium users (half as much, due to 10k vs 20k bars history limit).
Nota Keluaran
-re-wrote the code to use counters instead of Array looping function =>> much more efficient and quicker to load. Nota Keluaran
-Added tooltip to clarify usage/effects of user-selected TimezoneNota Keluaran
-Changed default table text color to red for those who use black chart backgroundSkrip sumber terbuka
Dalam semangat TradingView sebenar, pencipta skrip ini telah menjadikannya sumber terbuka, jadi pedagang boleh menilai dan mengesahkan kefungsiannya. Terima kasih kepada penulis! Walaupuan anda boleh menggunakan secara percuma, ingat bahawa penerbitan semula kod ini tertakluk kepada Peraturan Dalaman.
You can buy me a coffee here...
PayPal.Me/twingall
BTC: 3JrhUwNRnKyqhaa1n1AXKeAubNeEFoch6S
ETH erc20: 0x4b0400B1c18503529ab69611e82a934DDe4Ab038
ETH bep20: 0x1F0f03F184079bb1085F8C9dF3a8191C9f5869B3
PayPal.Me/twingall
BTC: 3JrhUwNRnKyqhaa1n1AXKeAubNeEFoch6S
ETH erc20: 0x4b0400B1c18503529ab69611e82a934DDe4Ab038
ETH bep20: 0x1F0f03F184079bb1085F8C9dF3a8191C9f5869B3
Penafian
Maklumat dan penerbitan adalah tidak bertujuan, dan tidak membentuk, nasihat atau cadangan kewangan, pelaburan, dagangan atau jenis lain yang diberikan atau disahkan oleh TradingView. Baca lebih dalam Terma Penggunaan.
Skrip sumber terbuka
Dalam semangat TradingView sebenar, pencipta skrip ini telah menjadikannya sumber terbuka, jadi pedagang boleh menilai dan mengesahkan kefungsiannya. Terima kasih kepada penulis! Walaupuan anda boleh menggunakan secara percuma, ingat bahawa penerbitan semula kod ini tertakluk kepada Peraturan Dalaman.
You can buy me a coffee here...
PayPal.Me/twingall
BTC: 3JrhUwNRnKyqhaa1n1AXKeAubNeEFoch6S
ETH erc20: 0x4b0400B1c18503529ab69611e82a934DDe4Ab038
ETH bep20: 0x1F0f03F184079bb1085F8C9dF3a8191C9f5869B3
PayPal.Me/twingall
BTC: 3JrhUwNRnKyqhaa1n1AXKeAubNeEFoch6S
ETH erc20: 0x4b0400B1c18503529ab69611e82a934DDe4Ab038
ETH bep20: 0x1F0f03F184079bb1085F8C9dF3a8191C9f5869B3
Penafian
Maklumat dan penerbitan adalah tidak bertujuan, dan tidak membentuk, nasihat atau cadangan kewangan, pelaburan, dagangan atau jenis lain yang diberikan atau disahkan oleh TradingView. Baca lebih dalam Terma Penggunaan.