OPEN-SOURCE SCRIPT
Telah dikemas kini Key Levels
Key Levels Indicator
In the world of trading, manually identifying and plotting key levels for every close can be a tedious and error-prone task. This indicator stands out by automatically detecting and plotting only those levels where a significant shift in market sentiment has occurred. Unlike traditional indicators that plot lines for every open or close, this tool focuses on levels where liquidity has changed hands, indicating a potential shift in momentum.
How It Works:
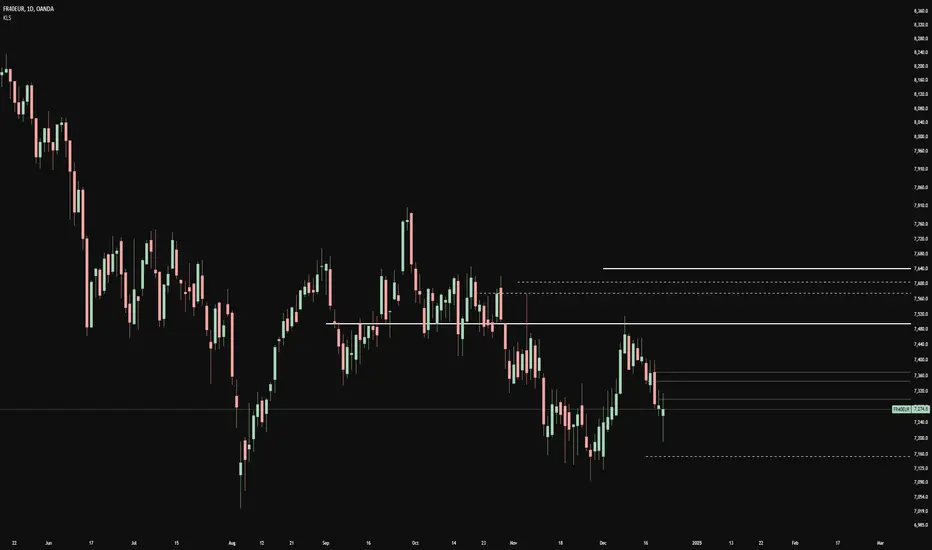
- The indicator identifies Higher Timeframe (HTF) reversals, plotting levels only when a bearish candle is followed by a bullish one, or vice versa.
- Weekly levels are represented by dashed lines, while monthly levels are solid, providing clear visual differentiation.
- Levels are drawn at the open price of the reversal candle, starting precisely at the beginning of the new HTF bar.
Why It's Different:
- Focuses on genuine shifts in market sentiment rather than arbitrary price points.
- Automatically manages the number of visible levels to prevent chart clutter.
- Ideal for range traders and mean reversion strategies, offering insights into potential support and resistance zones where market participants have shown a change in behavior.
Usage Note:
While this indicator provides valuable insights, it should not be used in isolation. Always consider the broader market context and combine it with other analysis techniques for optimal results.
Settings:
- Toggle weekly/monthly levels
- Adjust the number of visible levels (1-20)
- Customize level colors
In the world of trading, manually identifying and plotting key levels for every close can be a tedious and error-prone task. This indicator stands out by automatically detecting and plotting only those levels where a significant shift in market sentiment has occurred. Unlike traditional indicators that plot lines for every open or close, this tool focuses on levels where liquidity has changed hands, indicating a potential shift in momentum.
How It Works:
- The indicator identifies Higher Timeframe (HTF) reversals, plotting levels only when a bearish candle is followed by a bullish one, or vice versa.
- Weekly levels are represented by dashed lines, while monthly levels are solid, providing clear visual differentiation.
- Levels are drawn at the open price of the reversal candle, starting precisely at the beginning of the new HTF bar.
Why It's Different:
- Focuses on genuine shifts in market sentiment rather than arbitrary price points.
- Automatically manages the number of visible levels to prevent chart clutter.
- Ideal for range traders and mean reversion strategies, offering insights into potential support and resistance zones where market participants have shown a change in behavior.
Usage Note:
While this indicator provides valuable insights, it should not be used in isolation. Always consider the broader market context and combine it with other analysis techniques for optimal results.
Settings:
- Toggle weekly/monthly levels
- Adjust the number of visible levels (1-20)
- Customize level colors
Nota Keluaran
Key Levels IndicatorIn the world of trading, manually identifying and plotting key levels for every close can be a tedious and error-prone task. This indicator stands out by automatically detecting and plotting only those levels where a significant shift in market sentiment has occurred. Unlike traditional indicators that plot lines for every open or close, this tool focuses on levels where liquidity has changed hands, indicating a potential shift in momentum.
How It Works:
- The indicator identifies Higher Timeframe (HTF) reversals, plotting levels only when a bearish candle is followed by a bullish one, or vice versa.
- Weekly levels are represented by dashed lines, while monthly levels are solid, providing clear visual differentiation.
- Levels are drawn at the open price of the reversal candle, starting precisely at the beginning of the new HTF bar.
Why It's Different:
- Focuses on genuine shifts in market sentiment rather than arbitrary price points.
- Automatically manages the number of visible levels to prevent chart clutter.
- Ideal for range traders and mean reversion strategies, offering insights into potential support and resistance zones where market participants have shown a change in behavior.
Usage Note:
While this indicator provides valuable insights, it should not be used in isolation. Always consider the broader market context and combine it with other analysis techniques for optimal results.
Settings:
- Toggle weekly/monthly levels
- Adjust the number of visible levels (1-20)
- Customize level colors
- Added Custom Timeframes
Nota Keluaran
Added Custom Timeframe LevelsSkrip sumber terbuka
Dalam semangat TradingView sebenar, pencipta skrip ini telah menjadikannya sumber terbuka, jadi pedagang boleh menilai dan mengesahkan kefungsiannya. Terima kasih kepada penulis! Walaupuan anda boleh menggunakan secara percuma, ingat bahawa penerbitan semula kod ini tertakluk kepada Peraturan Dalaman.
Penafian
Maklumat dan penerbitan adalah tidak bertujuan, dan tidak membentuk, nasihat atau cadangan kewangan, pelaburan, dagangan atau jenis lain yang diberikan atau disahkan oleh TradingView. Baca lebih dalam Terma Penggunaan.
Skrip sumber terbuka
Dalam semangat TradingView sebenar, pencipta skrip ini telah menjadikannya sumber terbuka, jadi pedagang boleh menilai dan mengesahkan kefungsiannya. Terima kasih kepada penulis! Walaupuan anda boleh menggunakan secara percuma, ingat bahawa penerbitan semula kod ini tertakluk kepada Peraturan Dalaman.
Penafian
Maklumat dan penerbitan adalah tidak bertujuan, dan tidak membentuk, nasihat atau cadangan kewangan, pelaburan, dagangan atau jenis lain yang diberikan atau disahkan oleh TradingView. Baca lebih dalam Terma Penggunaan.