OPEN-SOURCE SCRIPT
Telah dikemas kini Risk Radar Pro
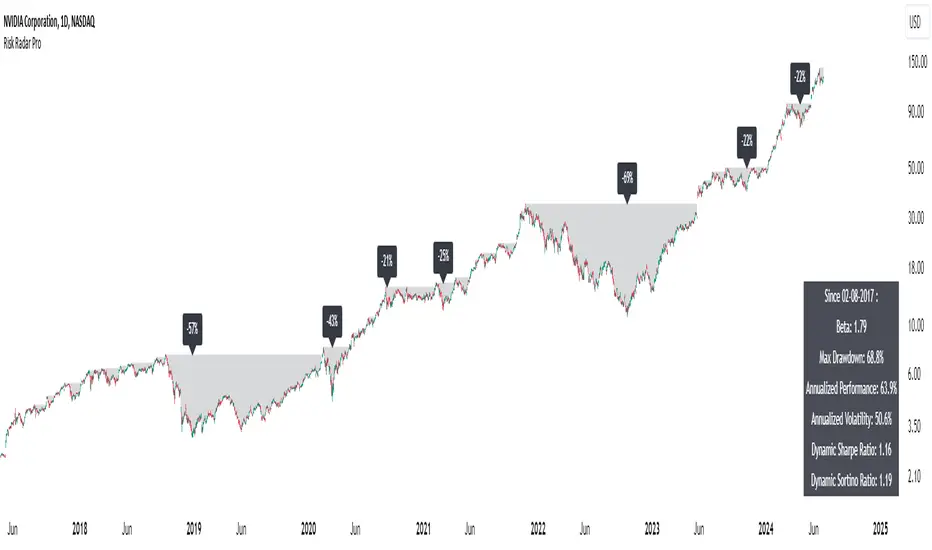
The "Risk Radar Pro" indicator is a sophisticated tool designed to help investors and traders assess the risk and performance of their investments over a specified period. This presentation will explain each component of the indicator, how to interpret the results, and the advantages compared to traditional metrics.
The "Risk Radar Pro" indicator includes several key metrics:
● Beta
● Maximum Drawdown
● Compound Annual Growth Rate (CAGR)
● Annualized Volatility
● Dynamic Sharpe Ratio
● Dynamic Sortino Ratio
Each of these metrics is dynamically calculated using data from the entire selected period, providing a more adaptive and accurate measure of performance and risk.
1. Start Date
2. Beta
3. Maximum Drawdown
4. Annualized Performance
5. Annualized Volatility
6. Dynamic Sharpe Ratio
7. Dynamic Sortino Ratio
Comparison with Basic Metrics
Conclusion
The "Risk Radar Pro" indicator is a powerful tool for investors and traders looking to assess and manage risk more effectively. By providing dynamic, comprehensive metrics, it offers a significant advantage over traditional static calculations, ensuring that users have the most accurate and relevant information to make informed decisions.
The "Risk Radar Pro" indicator provides analytical tools and metrics for informational purposes only. It is not intended as financial advice. Users should conduct their own research and consider their individual risk tolerance and investment objectives before making any investment decisions based on the indicator's outputs. Trading and investing involve risks, including the risk of loss. Past performance is not indicative of future results.
The "Risk Radar Pro" indicator includes several key metrics:
● Beta
● Maximum Drawdown
● Compound Annual Growth Rate (CAGR)
● Annualized Volatility
● Dynamic Sharpe Ratio
● Dynamic Sortino Ratio
Each of these metrics is dynamically calculated using data from the entire selected period, providing a more adaptive and accurate measure of performance and risk.
1. Start Date
● Description: The date from which the calculations begin.
● Interpretation: This allows the user to set a specific period for analysis, ensuring that all metrics reflect the performance from this point onward.
2. Beta
● Description: Beta measures the volatility or systematic risk of the instrument relative to a reference index (e.g., SPY).
● Interpretation: A beta of 1 indicates that the instrument moves with the market. A beta greater than 1 indicates more volatility than the market, while a beta less than 1 indicates less volatility.
● Advantages: Unlike classic beta, which typically uses fixed historical intervals, this dynamic beta adjusts to market changes over the entire selected period, providing a more responsive measure.
3. Maximum Drawdown
● Description: The maximum observed loss from a peak to a trough before a new peak is achieved.
● Interpretation: This shows the largest single drop in value during the specified period. It is a critical measure of downside risk.
● Advantages: By tracking the maximum drawdown dynamically, the indicator can provide timely alerts when significant losses occur, allowing for better risk management.
4. Annualized Performance
● Description: The mean annual growth rate of the investment over the specified period.
● Interpretation: The Annualized Performance represents the smoothed annual rate at which the investment would have grown if it had grown at a steady rate.
● Advantages: This dynamic calculation reflects the actual long-term growth trend of the investment rather than relying on a fixed time frame.
5. Annualized Volatility
● Description: Measures the degree of variation in the instrument's returns over time, expressed as a percentage.
● Interpretation: Higher volatility indicates greater risk, as the investment's returns fluctuate more.
● Advantages: Annualized volatility calculated over the entire selected period provides a more accurate measure of risk, as it includes all market conditions encountered during that time.
6. Dynamic Sharpe Ratio
● Description: Measures the risk-adjusted return of an investment relative to its volatility.
● Choice of Risk-Free Rate Ticker: Users can select a ticker symbol to represent the risk-free rate in Sharpe ratio calculations. The default option is US03M, representing the 3-month US Treasury bill.
● Interpretation: A higher Sharpe ratio indicates better risk-adjusted returns. This ratio accounts for the risk-free rate to provide a comparison with risk-free investments.
● Advantages: By using returns and volatility over the entire period, the dynamic Sharpe ratio adjusts to changes in market conditions, offering a more accurate measure than traditional static calculations.
7. Dynamic Sortino Ratio
● Description: Similar to the Sharpe ratio, but focuses only on downside risk.
Interpretation: A higher Sortino ratio indicates better risk-adjusted returns, focusing solely on negative returns, which are more relevant to risk-averse investors.
● Choice of Risk-Free Rate Ticker: Similarly, users can choose a ticker symbol for the risk-free rate in Sortino ratio calculations. By default, this is also set to US03M.
● Advantages: This ratio's dynamic calculation considering the downside deviation over the entire period provides a more accurate measure of risk-adjusted returns in volatile markets.
Comparison with Basic Metrics
● Static vs. Dynamic Calculations: Traditional metrics often use fixed historical intervals, which may not reflect current market conditions. The dynamic calculations in "Risk Radar Pro" adjust to market changes, providing more relevant and timely information.
● Comprehensive Risk Assessment: By including metrics like maximum drawdown, Sharpe ratio, and Sortino ratio, the indicator provides a holistic view of both upside potential and downside risk.
● User Customization: Users can customize the start date, reference index, risk-free rate, and table position, tailoring the indicator to their specific needs and preferences.
Conclusion
The "Risk Radar Pro" indicator is a powerful tool for investors and traders looking to assess and manage risk more effectively. By providing dynamic, comprehensive metrics, it offers a significant advantage over traditional static calculations, ensuring that users have the most accurate and relevant information to make informed decisions.
The "Risk Radar Pro" indicator provides analytical tools and metrics for informational purposes only. It is not intended as financial advice. Users should conduct their own research and consider their individual risk tolerance and investment objectives before making any investment decisions based on the indicator's outputs. Trading and investing involve risks, including the risk of loss. Past performance is not indicative of future results.
Nota Keluaran
Minor UpdateNota Keluaran
Small bug fixedNota Keluaran
Small bug fixedNota Keluaran
Small bug fixedNota Keluaran
Size option addedSkrip sumber terbuka
Dalam semangat TradingView sebenar, pencipta skrip ini telah menjadikannya sumber terbuka, jadi pedagang boleh menilai dan mengesahkan kefungsiannya. Terima kasih kepada penulis! Walaupuan anda boleh menggunakan secara percuma, ingat bahawa penerbitan semula kod ini tertakluk kepada Peraturan Dalaman.
Plan the trade ⚡ Trade the plan
Penafian
Maklumat dan penerbitan adalah tidak bertujuan, dan tidak membentuk, nasihat atau cadangan kewangan, pelaburan, dagangan atau jenis lain yang diberikan atau disahkan oleh TradingView. Baca lebih dalam Terma Penggunaan.
Skrip sumber terbuka
Dalam semangat TradingView sebenar, pencipta skrip ini telah menjadikannya sumber terbuka, jadi pedagang boleh menilai dan mengesahkan kefungsiannya. Terima kasih kepada penulis! Walaupuan anda boleh menggunakan secara percuma, ingat bahawa penerbitan semula kod ini tertakluk kepada Peraturan Dalaman.
Plan the trade ⚡ Trade the plan
Penafian
Maklumat dan penerbitan adalah tidak bertujuan, dan tidak membentuk, nasihat atau cadangan kewangan, pelaburan, dagangan atau jenis lain yang diberikan atau disahkan oleh TradingView. Baca lebih dalam Terma Penggunaan.