PROTECTED SOURCE SCRIPT
Atlas Trend Rsi
Atlas Trend RSI – User Guide
1. Indicator Purpose
Atlas Trend RSI combines a classic RSI oscillator on the average price with optional smoothing, color-coded zones, and automatic pivot signals. It highlights overbought/oversold extremes, neutral ranges, and divergence-based profit-taking points.
2. Inputs & Configuration
Timeframe: Select a higher or lower timeframe RSI to overlay on your chart. Leave blank to match the chart’s timeframe.
Period: The length of the RSI calculation (default 14). Shorter values increase sensitivity; longer values smooth the line.
MA Type (SMA/EMA/RMA/WMA/VWMA): When “Average” is enabled, this applies a moving average to the RSI to filter noise.
Show Average: Toggle on to plot the smoothed RSI line. Use in ranging markets to reduce false signals.
Show Divergence Line: Toggles drawing of a line connecting RSI pivot highs/lows to help you spot hidden or regular divergence.
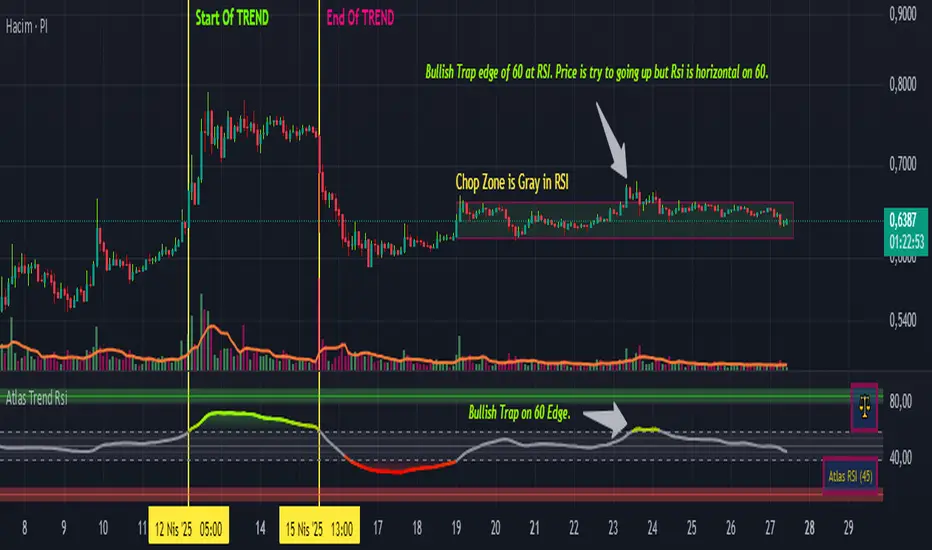
3. Colored Zones & Interpretation
10–40 (Oversold Zone): Shade in red. Watch for bullish reversals when RSI turns up from this area.
40–60 (Neutral Zone): Light gray. Indicates consolidation—no strong trend.
60–90 (Overbought Zone): Shade in green. Watch for bearish reversals when RSI turns down from this area.
Mid-zone (50 line): A break above/below 50 can confirm a shift from bearish to bullish momentum or vice versa.
4. Signal Tables & Emojis
Top-right: Bull 🐂, Bear 🐻 or Scale ⚖️ emoji appears when RSI pivot conditions trigger:
🐂 when a profitable long-exit (RSI peaked and turned down above overbought).
🐻 when a profitable short-exit (RSI troughed and turned up below oversold).
⚖️ when no clear pivot.
Bottom-right: Displays the current RSI value in parentheses for at-a-glance monitoring.
5. Alert Conditions
Two built-in alerts are available:
Long Profit-Take: Fires when RSI turns down after reaching your overbought threshold.
Short Profit-Take: Fires when RSI turns up after reaching your oversold threshold.
To enable, open the Alerts dialog, select “Atlas Trend RSI,” then choose “Long Profit-Take” or “Short Profit-Take.”
6. Recommended Usage
Trend Confirmation: In a strong uptrend, use dips into the 40–60 zone as buy opportunities; exits when you see the 🐂 alert.
Range Trading: In sideways markets, buy near the 10–20 level and sell near the 80–90 level, using the average line to filter noise.
Divergence Spotting: Enable “Divergence Line” to draw lines between price swings and RSI swings—look for hidden divergence (supports trend) or regular divergence (signals reversal).
Multi-TF Analysis: Apply a 4-hour RSI on a 1-hour chart to see the higher-TF momentum context.
7. Disclaimers
For educational purposes only; not financial advice.
Past performance does not guarantee future results.
Use these explanations in your TradingView publish dialog under “How to use” or “Usage.” Traders will immediately understand what each colored zone, emoji, and alert means and how to apply Atlas Trend RSI in their strategies.
1. Indicator Purpose
Atlas Trend RSI combines a classic RSI oscillator on the average price with optional smoothing, color-coded zones, and automatic pivot signals. It highlights overbought/oversold extremes, neutral ranges, and divergence-based profit-taking points.
2. Inputs & Configuration
Timeframe: Select a higher or lower timeframe RSI to overlay on your chart. Leave blank to match the chart’s timeframe.
Period: The length of the RSI calculation (default 14). Shorter values increase sensitivity; longer values smooth the line.
MA Type (SMA/EMA/RMA/WMA/VWMA): When “Average” is enabled, this applies a moving average to the RSI to filter noise.
Show Average: Toggle on to plot the smoothed RSI line. Use in ranging markets to reduce false signals.
Show Divergence Line: Toggles drawing of a line connecting RSI pivot highs/lows to help you spot hidden or regular divergence.
3. Colored Zones & Interpretation
10–40 (Oversold Zone): Shade in red. Watch for bullish reversals when RSI turns up from this area.
40–60 (Neutral Zone): Light gray. Indicates consolidation—no strong trend.
60–90 (Overbought Zone): Shade in green. Watch for bearish reversals when RSI turns down from this area.
Mid-zone (50 line): A break above/below 50 can confirm a shift from bearish to bullish momentum or vice versa.
4. Signal Tables & Emojis
Top-right: Bull 🐂, Bear 🐻 or Scale ⚖️ emoji appears when RSI pivot conditions trigger:
🐂 when a profitable long-exit (RSI peaked and turned down above overbought).
🐻 when a profitable short-exit (RSI troughed and turned up below oversold).
⚖️ when no clear pivot.
Bottom-right: Displays the current RSI value in parentheses for at-a-glance monitoring.
5. Alert Conditions
Two built-in alerts are available:
Long Profit-Take: Fires when RSI turns down after reaching your overbought threshold.
Short Profit-Take: Fires when RSI turns up after reaching your oversold threshold.
To enable, open the Alerts dialog, select “Atlas Trend RSI,” then choose “Long Profit-Take” or “Short Profit-Take.”
6. Recommended Usage
Trend Confirmation: In a strong uptrend, use dips into the 40–60 zone as buy opportunities; exits when you see the 🐂 alert.
Range Trading: In sideways markets, buy near the 10–20 level and sell near the 80–90 level, using the average line to filter noise.
Divergence Spotting: Enable “Divergence Line” to draw lines between price swings and RSI swings—look for hidden divergence (supports trend) or regular divergence (signals reversal).
Multi-TF Analysis: Apply a 4-hour RSI on a 1-hour chart to see the higher-TF momentum context.
7. Disclaimers
For educational purposes only; not financial advice.
Past performance does not guarantee future results.
Use these explanations in your TradingView publish dialog under “How to use” or “Usage.” Traders will immediately understand what each colored zone, emoji, and alert means and how to apply Atlas Trend RSI in their strategies.
Skrip dilindungi
Skrip ini diterbitkan sebagai sumber tertutup. Akan tetapi, anda boleh menggunakannya secara bebas dan tanpa apa-apa had – ketahui lebih di sini.
Penafian
Maklumat dan penerbitan adalah tidak bertujuan, dan tidak membentuk, nasihat atau cadangan kewangan, pelaburan, dagangan atau jenis lain yang diberikan atau disahkan oleh TradingView. Baca lebih dalam Terma Penggunaan.