PROTECTED SOURCE SCRIPT
Telah dikemas kini RSIEW V2 Thermal Falsecolor show Hot (Impulse) Cold (Correction)
HI BIG PLAYER AROUND THE WORLD,
here is my new creation of modified RSI Indikator.
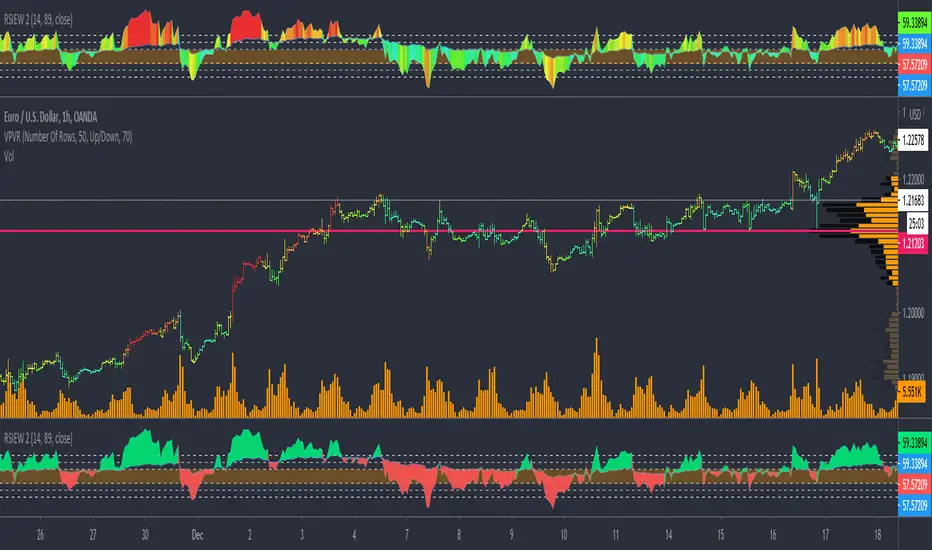
In order to the RSIEW Version 1 (look below this text) I build a thermal rainbow chart that shows the spectrum with all overbought and oversell phases. The colour spectrum can be compared with a thermal imaging camera.
In one hand, the hottest candles (going into red) show the extrem points of the chart. In trend direction this is often wave 3 of Elliott Waves theory and in correction phase it show the bounce period.
In other hand, the coldest candles (going into blue) show the weak points of the chart. In trend direction this is often a "cooling down" and in big correction phases it demonstrate frozen prices (really unattractive trading time).
Have fun with this and give me a feedback.
Of course, you are invited to follow me.
KIND REGARDS
NXT2017
here is my new creation of modified RSI Indikator.
In order to the RSIEW Version 1 (look below this text) I build a thermal rainbow chart that shows the spectrum with all overbought and oversell phases. The colour spectrum can be compared with a thermal imaging camera.
In one hand, the hottest candles (going into red) show the extrem points of the chart. In trend direction this is often wave 3 of Elliott Waves theory and in correction phase it show the bounce period.
In other hand, the coldest candles (going into blue) show the weak points of the chart. In trend direction this is often a "cooling down" and in big correction phases it demonstrate frozen prices (really unattractive trading time).
Have fun with this and give me a feedback.
Of course, you are invited to follow me.
KIND REGARDS
NXT2017
Nota Keluaran
- add manually color choose functions- fixed bugs on color
Skrip dilindungi
Skrip ini diterbitkan sebagai sumber tertutup. Akan tetapi, anda boleh menggunakannya secara bebas dan tanpa apa-apa had – ketahui lebih di sini.
🐺 Wolfe Wave AutoPattern: nxt2017.com/ww
🎯 Elliott Wave Auto Counting: nxt2017.com/ew
💥 Impulse Scalper: nxt2017.com/im
📈 Cheapest Entry: nxt2017.com/pi
Discount Coupon:
nxtcoupon20 for -20%
🎯 Elliott Wave Auto Counting: nxt2017.com/ew
💥 Impulse Scalper: nxt2017.com/im
📈 Cheapest Entry: nxt2017.com/pi
Discount Coupon:
nxtcoupon20 for -20%
Penafian
Maklumat dan penerbitan adalah tidak bertujuan, dan tidak membentuk, nasihat atau cadangan kewangan, pelaburan, dagangan atau jenis lain yang diberikan atau disahkan oleh TradingView. Baca lebih dalam Terma Penggunaan.