OPEN-SOURCE SCRIPT
Linear Regression Volume Profile [ChartPrime]

LR VolumeProfile [ChartPrime]
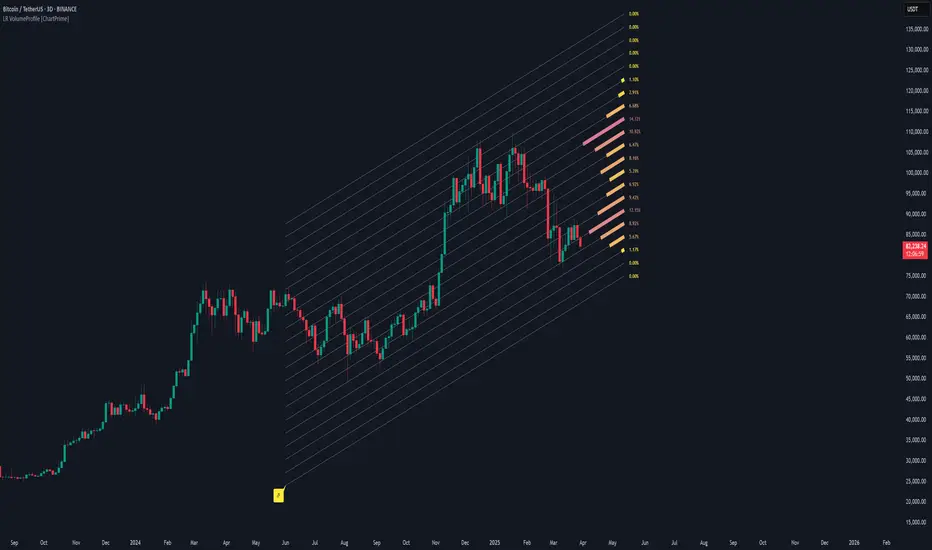
This indicator combines a Linear Regression channel with a dynamic volume profile, giving traders a powerful way to visualize both directional price movement and volume concentration along the trend.
⯁ KEY FEATURES
⯁ HOW TO USE
⯁ CONCLUSION
LR Volume Profile [ChartPrime] is a precision tool for traders who want to merge trend analysis with volume insight. By integrating linear regression trendlines with a clean and readable volume distribution, this indicator helps traders find price levels that matter the most—backed by volume, trend, and structure. Whether you're spotting high-volume nodes or gauging directional flow, this toolkit elevates your decision-making process with clarity and depth.
This indicator combines a Linear Regression channel with a dynamic volume profile, giving traders a powerful way to visualize both directional price movement and volume concentration along the trend.
⯁ KEY FEATURES
- Linear Regression Channel: Draws a statistically fitted channel to track the market trend over a defined period.
- Volume Profile Overlay: Splits the channel into multiple horizontal levels and calculates volume traded within each level.
- Percentage-Based Labels: Displays each level's share of total volume as a percentage, offering a clean way to see high and low volume zones.
- Gradient Bars: Profile bars are colored using a gradient scale from yellow (low volume) to red (high volume), making it easy to identify key interest areas.
- Adjustable Profile Width and Resolution: Users can change the width of profile bars and spacing between levels.
- Channel Direction Indicator: An arrow inside a floating label shows the direction (up or down) of the current linear regression slope.
- Level Style Customization: Choose from solid, dashed, or dotted lines for visual preference.
⯁ HOW TO USE
- Use the Linear Regression channel to determine the dominant price trend direction.
- Analyze the volume bars to spot key levels where the majority of volume was traded—these act as potential support/resistance zones.
- Pay attention to the largest profile bars—these often mark zones of institutional interest or price consolidation.
- The arrow label helps quickly assess whether the trend is upward or downward.
- Combine this tool with price action or momentum indicators to build high-confidence trading setups.
⯁ CONCLUSION
LR Volume Profile [ChartPrime] is a precision tool for traders who want to merge trend analysis with volume insight. By integrating linear regression trendlines with a clean and readable volume distribution, this indicator helps traders find price levels that matter the most—backed by volume, trend, and structure. Whether you're spotting high-volume nodes or gauging directional flow, this toolkit elevates your decision-making process with clarity and depth.
Skrip sumber terbuka
Dalam semangat TradingView sebenar, pencipta skrip ini telah menjadikannya sumber terbuka, jadi pedagang boleh menilai dan mengesahkan kefungsiannya. Terima kasih kepada penulis! Walaupuan anda boleh menggunakan secara percuma, ingat bahawa penerbitan semula kod ini tertakluk kepada Peraturan Dalaman.
Penafian
Maklumat dan penerbitan adalah tidak bertujuan, dan tidak membentuk, nasihat atau cadangan kewangan, pelaburan, dagangan atau jenis lain yang diberikan atau disahkan oleh TradingView. Baca lebih dalam Terma Penggunaan.