OPEN-SOURCE SCRIPT
Telah dikemas kini Morning Break Out
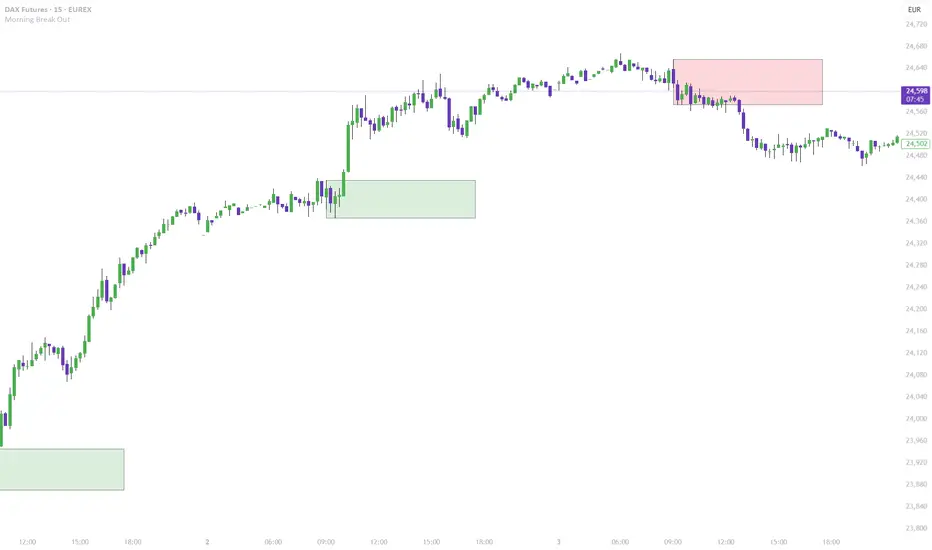
This indicator visualizes a classic morning breakout setup for the DAX and other European markets. The first hour often sets the tone for the trading day — this tool helps you identify that visually and react accordingly.
🔍 How It Works:
Box Range Calculation:
The high and low between 09:00 and 10:00 define the top and bottom of the box.
Color Logic:
Green: Price breaks above the box after 10:00 → bullish breakout
Red: Price breaks below the box after 10:00 → bearish breakout
Gray: No breakout → neutral phase
📈 Use Cases:
Identify breakout setups visually
Ideal for intraday traders and momentum strategies
Combine with volume or trend filters
⚙️ Notes:
Recommended for timeframes 1-minute and above
Uses the chart’s local timezone (e.g. CET/CEST for XETRA/DAX)
Works on all instruments with data before 09:00 — perfect for DAX, EuroStoxx, futures, FX, CFDs, etc.
Nota Keluaran
This indicator visualizes a classic morning breakout setup for the DAX and other European markets. The first hour often sets the tone for the trading day — this tool helps you identify that visually and react accordingly.🔍 How It Works:
Box Range Calculation:
The high and low between 09:00 and 10:00 define the top and bottom of the box.
Color Logic:
Green: Price breaks above the box after 10:00 → bullish breakout
Red: Price breaks below the box after 10:00 → bearish breakout
Gray: No breakout → neutral phase
📈 Use Cases:
Identify breakout setups visually
Ideal for intraday traders and momentum strategies
Combine with volume or trend filters
⚙️ Notes:
Recommended for timeframes 1-minute and above
Uses the chart’s local timezone (e.g. CET/CEST for XETRA/DAX)
Works on all instruments with data before 09:00 — perfect for DAX, EuroStoxx, futures, FX, CFDs, etc.
Skrip sumber terbuka
Dalam semangat TradingView sebenar, pencipta skrip ini telah menjadikannya sumber terbuka, jadi pedagang boleh menilai dan mengesahkan kefungsiannya. Terima kasih kepada penulis! Walaupuan anda boleh menggunakan secara percuma, ingat bahawa penerbitan semula kod ini tertakluk kepada Peraturan Dalaman.
Penafian
Maklumat dan penerbitan adalah tidak bertujuan, dan tidak membentuk, nasihat atau cadangan kewangan, pelaburan, dagangan atau jenis lain yang diberikan atau disahkan oleh TradingView. Baca lebih dalam Terma Penggunaan.