OPEN-SOURCE SCRIPT
Horizontal lines by Aydmaxx
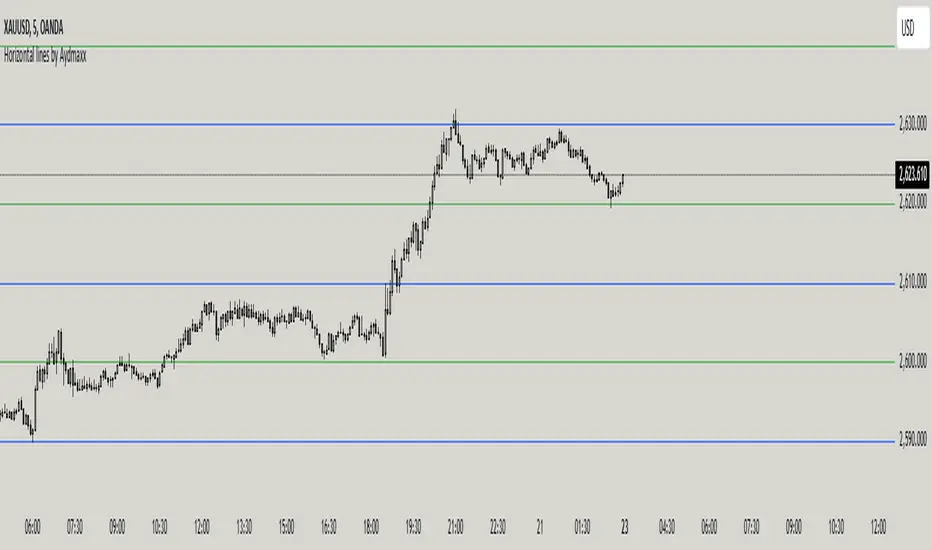
Indicator Description: Horizontal Lines by Aydmaxx
This indicator plots customizable horizontal lines on the chart to assist with technical analysis. It allows traders to define a starting price and a step size (gap) between the lines, making it versatile for a variety of strategies, such as identifying support, resistance, or key price levels.
How to Use:
Starting Price (Bottom): Enter the price level where the first (lowest) line should begin. This is your base level.
Example: If you're analyzing a market with prices around 2550, you can set this value to 2550 to align the indicator with your focus.
Gap (Step Size): Specify the interval or step size between consecutive lines.
Example: If you want lines every 10 points, set this value to 10.
Number of Lines: Adjust the total number of lines to display on the chart.
Line Style and Width: Customize the appearance of the lines (solid, dashed, dotted) and their thickness.
Line Colors and Transparency: Choose primary and secondary colors for alternating lines, and adjust the transparency to match your visual preferences.
This indicator is ideal for visualizing price zones and can be tailored to suit any trading style. Adjust the parameters based on your market analysis to highlight key price levels effectively.
Skrip sumber terbuka
Dalam semangat TradingView sebenar, pencipta skrip ini telah menjadikannya sumber terbuka, jadi pedagang boleh menilai dan mengesahkan kefungsiannya. Terima kasih kepada penulis! Walaupuan anda boleh menggunakan secara percuma, ingat bahawa penerbitan semula kod ini tertakluk kepada Peraturan Dalaman.
Penafian
Maklumat dan penerbitan adalah tidak bertujuan, dan tidak membentuk, nasihat atau cadangan kewangan, pelaburan, dagangan atau jenis lain yang diberikan atau disahkan oleh TradingView. Baca lebih dalam Terma Penggunaan.