PROTECTED SOURCE SCRIPT
Earnings X-Ray and Fundamentals Data:VSMarketTrend
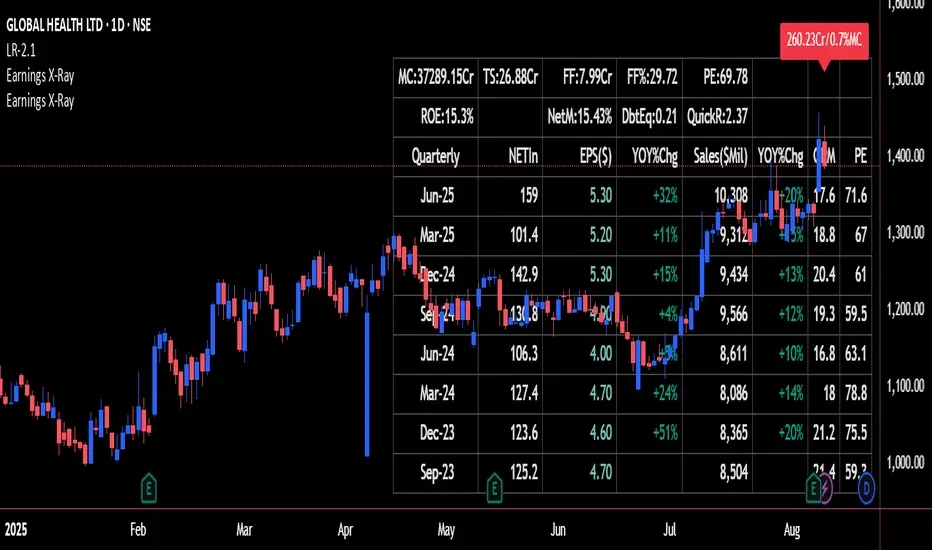
This indicator calculates essential financial metrics for stocks using TradingView's built-in functions and custom algorithms. The values are derived from fundamental data sources available on TradingView.
Key Output Metrics(YOY Basic Quaterly DATA)
MC (Market Cap): Company’s total market value (Price × Total Shares).
TS (Total Shares Outstanding): All shares (float + restricted) in circulation.
Sales: Annual revenue (TTM or latest fiscal year).
NETIn: Net income
P/E (Price-to-Earnings): Valuation ratio (Market Cap / Net Income or Price / EPS).
EPS (Earnings Per Share): Net income per share (Net Income / TS).
OPM (Operating Margin %): Core profitability (Operating Income / Revenue × 100).
Quick Ratio: Short-term liquidity ((Current Assets – Inventory) / Current Liabilities).
BVPS (Book Value Per Share): Equity per share (Shareholders’ Equity / TS).
PS (Price-to-Sales): Revenue-based valuation (Market Cap / Annual Revenue).
FCF (Free Cash Flow Per Share): Post-CapEx cash ((Operating Cash Flow – CapEx) / TS).
Data Sources & Methods
Uses TradingView’s request.financial() for income/balance sheet data (Revenue, EBITDA, etc.).
Fetches real-time metrics via request.security() (e.g., Shares Outstanding).
Normalizes data across timeframes (quarterly/annual).

Disclaimer
Not financial advice. Verify with official filings before trading.
Key Output Metrics(YOY Basic Quaterly DATA)
MC (Market Cap): Company’s total market value (Price × Total Shares).
TS (Total Shares Outstanding): All shares (float + restricted) in circulation.
Sales: Annual revenue (TTM or latest fiscal year).
NETIn: Net income
P/E (Price-to-Earnings): Valuation ratio (Market Cap / Net Income or Price / EPS).
EPS (Earnings Per Share): Net income per share (Net Income / TS).
OPM (Operating Margin %): Core profitability (Operating Income / Revenue × 100).
Quick Ratio: Short-term liquidity ((Current Assets – Inventory) / Current Liabilities).
BVPS (Book Value Per Share): Equity per share (Shareholders’ Equity / TS).
PS (Price-to-Sales): Revenue-based valuation (Market Cap / Annual Revenue).
FCF (Free Cash Flow Per Share): Post-CapEx cash ((Operating Cash Flow – CapEx) / TS).
Data Sources & Methods
Uses TradingView’s request.financial() for income/balance sheet data (Revenue, EBITDA, etc.).
Fetches real-time metrics via request.security() (e.g., Shares Outstanding).
Normalizes data across timeframes (quarterly/annual).
Disclaimer
Not financial advice. Verify with official filings before trading.
Skrip dilindungi
Skrip ini diterbitkan sebagai sumber tertutup. Akan tetapi, anda boleh menggunakannya secara bebas dan tanpa apa-apa had – ketahui lebih di sini.
Penafian
Maklumat dan penerbitan adalah tidak bertujuan, dan tidak membentuk, nasihat atau cadangan kewangan, pelaburan, dagangan atau jenis lain yang diberikan atau disahkan oleh TradingView. Baca lebih dalam Terma Penggunaan.