OPEN-SOURCE SCRIPT
Swing Levels
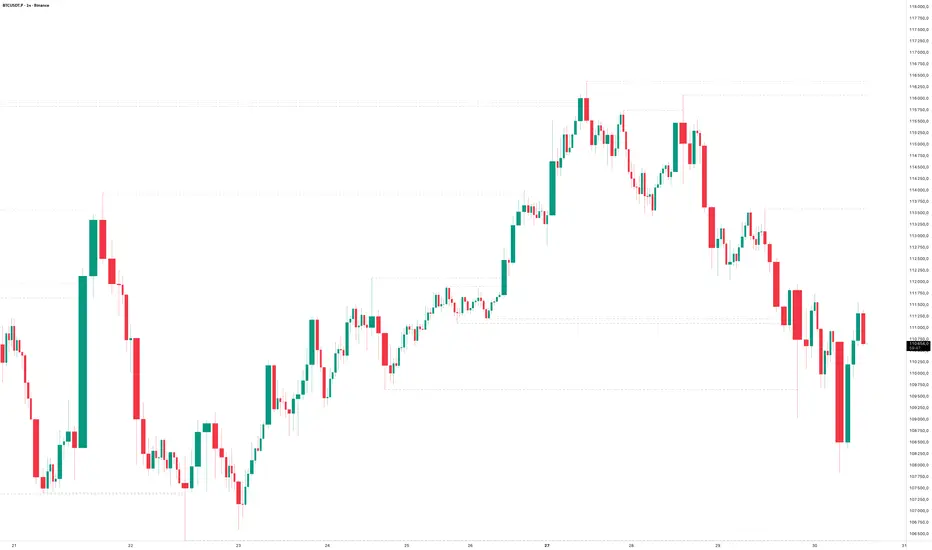
The Swing Levels indicator automatically detects and plots recent swing highs and lows on the chart, turning them into dynamic support and resistance levels.
Each new swing point creates a horizontal line that extends forward in time until price “fills” (touches or breaks) that level. Once a level is filled, it can either disappear or remain visible — depending on your settings.
You can enable alerts to be notified whenever price fills a swing high (breaks resistance) or a swing low (breaks support).
A lookback filter allows limiting how far back in history swing levels are drawn, helping keep the chart clean and efficient.
Main benefits:
• Automatically tracks key market structure turning points
• Helps visualize support and resistance zones in real time
• Optional alerts for breakout confirmations
• Fully customizable colors, line styles, and management behavior
• Works on any timeframe or market
In short:
Swing Levels gives you a clear and automated view of where price has recently reversed — powerful zones where liquidity and reactions often occur again.
Сreated with vibecoding using ChatGPT and Claude.
Skrip sumber terbuka
Dalam semangat TradingView sebenar, pencipta skrip ini telah menjadikannya sumber terbuka, jadi pedagang boleh menilai dan mengesahkan kefungsiannya. Terima kasih kepada penulis! Walaupuan anda boleh menggunakan secara percuma, ingat bahawa penerbitan semula kod ini tertakluk kepada Peraturan Dalaman.
Penafian
Maklumat dan penerbitan adalah tidak bertujuan, dan tidak membentuk, nasihat atau cadangan kewangan, pelaburan, dagangan atau jenis lain yang diberikan atau disahkan oleh TradingView. Baca lebih dalam Terma Penggunaan.