Wizard Dynamic EMA Table
Track Multiple EMAs:
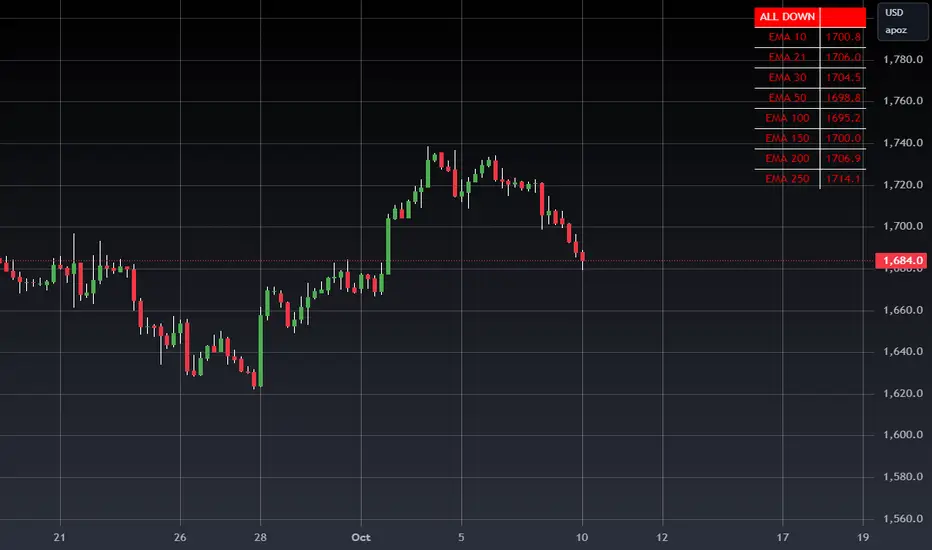
Displays 8 EMAs with their respective values.
Indicates whether each EMA is trending upward (green) or downward (red).
Summary Indicator:
A top cell provides a quick, overall trend:
Green ("ALL UP"): All EMAs are trending upward.
Red ("ALL DOWN"): All EMAs are trending downward.
Gray ("MIXED"): Some EMAs are up, and some are down.
Customizable:
The user can configure EMA periods to match their trading strategy.
Click Add to Chart (top-right corner of the Pine Editor).
The dashboard will appear on your chart.
How to Use the Dashboard
Monitor EMAs:
Look at the EMA table for real-time updates on each EMA's value and trend (up or down).
Quick Market Trend Analysis:
Check the summary cell at the top:
ALL UP (Green): Strong upward trend across all monitored EMAs.
ALL DOWN (Red): Strong downward trend across all monitored EMAs.
MIXED (Gray): Market is indecisive or ranging.
Customize EMA Periods:
Adjust the EMA periods from the script's settings:
Click the gear icon on the indicator in the chart legend.
Modify the EMA periods to match your trading strategy (e.g., 21, 50, 100, etc.).
Apply to Any Asset:
Use this script for any asset (stocks, forex, crypto, futures) available on TradingView.
Trading Strategies with the Dashboard
Trend-Following Strategy:
If the summary cell shows ALL UP, consider looking for long opportunities.
If the summary cell shows ALL DOWN, consider looking for short opportunities.
Reversal Strategy:
When the summary changes from ALL UP to MIXED or ALL DOWN, it might signal a weakening uptrend or potential reversal.
Confluence with Other Indicators:
Apply the dashboard to any timeframe (e.g., 1-minute, 1-hour, daily) depending on your trading style.
Benefits of Using This Script
Saves Time:
Quickly analyze trends across multiple EMAs without manually calculating or interpreting each one.
Visual Clarity:
The color-coded table provides instant insights into market conditions.
Customizable:
Tailor the EMA periods and apply it to any asset or timeframe.
"Disclaimer: This indicator is intended for educational purposes only and does not constitute financial advice. Trading involves significant risk, and users should perform their own research and consult with a licensed financial advisor before making any trading decisions."
Skrip jemputan sahaja
Hanya pengguna disahkan oleh penulis boleh mengakses skrip ini. Anda perlu memohon dan mendapatkan kebenaran untuk menggunakannya. Keizinan selalunya diberikan selepas pembayaran. Untuk lebih butiran, ikuti arahan penulis di bawah atau hubungi WIZARDTRENDS secara terus.
Ambil maklum bahawa skrip peribadi dan jemputan sahaja ini masih belum disemak oleh moderator skrip dan pematuhannya dengan Peraturan Dalaman adalah belum ditentukan. TradingView TIDAK menyarankan pembayaran atau penggunaan skrip kecuali anda mempercayai sepenuhnya penulis dan memahami bagaimana ia berfungsi. Anda juga boleh menjumpai alternatif sumber terbuka dan percuma yang lain di dalam skrip komuniti kami.
Arahan penulis
Penafian
Skrip jemputan sahaja
Hanya pengguna disahkan oleh penulis boleh mengakses skrip ini. Anda perlu memohon dan mendapatkan kebenaran untuk menggunakannya. Keizinan selalunya diberikan selepas pembayaran. Untuk lebih butiran, ikuti arahan penulis di bawah atau hubungi WIZARDTRENDS secara terus.
Ambil maklum bahawa skrip peribadi dan jemputan sahaja ini masih belum disemak oleh moderator skrip dan pematuhannya dengan Peraturan Dalaman adalah belum ditentukan. TradingView TIDAK menyarankan pembayaran atau penggunaan skrip kecuali anda mempercayai sepenuhnya penulis dan memahami bagaimana ia berfungsi. Anda juga boleh menjumpai alternatif sumber terbuka dan percuma yang lain di dalam skrip komuniti kami.