PROTECTED SOURCE SCRIPT
52SIGNAL RECIPE Whale Smart Money Detector
52SIGNAL RECIPE Whale Smart Money Detector
◆ Overview
52SIGNAL RECIPE Whale Smart Money Detector is an innovative indicator that detects the movements of whales (large investors) in the cryptocurrency market in real-time. This powerful tool tracks large-scale trading activities that significantly impact the market, providing valuable signals before important market direction changes occur. It can be applied to any cryptocurrency chart, allowing traders to follow the movements of big money anytime, anywhere.
The unique strength of this indicator lies in its comprehensive analysis of volume surges, price volatility, and trend strength to accurately capture whale market entries and exits. By providing clear visual representation of large fund flow data that is difficult for ordinary traders to detect, you gain the opportunity to move alongside the big players in the market.
─────────────────────────────────────
◆ Key Features
• Whale Activity Detection System: Analyzes volume surges and price impacts to capture large investor movements in real-time
• Precise Volume Analysis: Distinguishes between regular volume and whale volume to track only meaningful market movements
• Market Impact Measurement: Quantifies and analyzes the real impact of whale buying/selling on the market
• Continuity Tracking: Follows market direction continuity after whale activity to confirm signal validity
• Intuitive Visualization: Easily identifies whale activity points through color bar charts and clear labels
• Trend Strength Display: Calculates and displays current market buy/sell strength in real-time in a table
• Whale Signal Filtering: Applies multiple filtering systems to detect only genuine whale activity
• Customizable Sensitivity Settings: Offers flexible parameters to adjust whale detection sensitivity according to market conditions
─────────────────────────────────────
◆ Understanding Signal Types
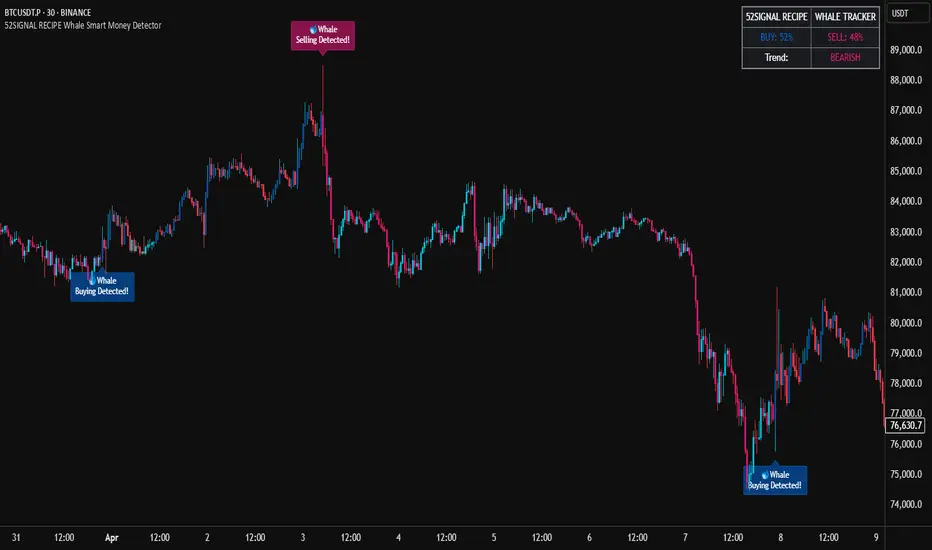
■ Whale Buy Signal
• Definition: Occurs when volume increases significantly above average, immediate volume impact is large, and price rises beyond normal volatility
• Visual Representation: Translucent blue bar coloring with "🐋Whale Buying Detected!" label on the candle where the buy signal occurs
• Market Interpretation: Indicates that large funds are actively buying the coin, which is likely to lead to price increases
■ Whale Sell Signal
• Definition: Occurs when volume increases significantly above average, immediate volume impact is large, and price falls beyond normal volatility
• Visual Representation: Translucent pink bar coloring with "🐋Whale Selling Detected!" label on the candle where the sell signal occurs
• Market Interpretation: Indicates that large funds are actively selling the coin, which is likely to lead to price decreases
─────────────────────────────────────
◆ Understanding Trend Analysis
■ Trend Analysis Method
• Definition: Measures current trend and strength by analyzing the ratio of up/down candles over a set period
• Visual Representation: Displayed in the table as "BUY" and "SELL" percentages, with the current trend clearly marked as "BULLISH", "BEARISH", or "NEUTRAL"
• Calculation Method:
▶ Buy ratio = (Number of up candles) / (Total analysis period)
▶ Sell ratio = (Number of down candles) / (Total analysis period)
▶ Current trend determined by the dominant ratio as "BULLISH" or "BEARISH"
■ Trend Utilization Methods
• Whale Signal Confirmation: Signal reliability increases when whale signals align with the current trend
• Reversal Point Identification: Opposing whale signals during strong trends may indicate important reversal points
• Market Strength Assessment: Understand the balance of power in the current market through buy/sell ratios
• Signal Context Understanding: Consider trend information alongside whale signals for interpretation in a broader market context
─────────────────────────────────────
◆ Indicator Settings Guide
■ Key Setting Parameters
• Volume Impact Factor:
▶ Purpose: Sets the minimum multiplier for immediate volume impact to be considered whale activity
▶ Lower values: Generate more signals, detect smaller whales
▶ Higher values: Fewer signals, detect only very large whales
▶ Recommended range: 2.0-4.0 (adjust according to market conditions)
• Sensitivity Factor:
▶ Purpose: Adjusts sensitivity of price movement relative to normal volatility
▶ Lower values: Increased sensitivity, more signals generated
▶ Higher values: Decreased sensitivity, only stronger price impacts detected
▶ Recommended range: 0.2-0.5 (set higher in highly volatile markets)
• Trend Analysis Period:
▶ Purpose: Sets the number of candles to calculate buy/sell ratios
▶ Lower values: More responsive to recent trends
▶ Higher values: More stable analysis considering longer-term trends
▶ Recommended range: 30-70 (adjust according to trading style)
─────────────────────────────────────
◆ Synergy with Other Indicators
• Key Support/Resistance Levels:
▶ Whale signals occurring near important technical levels have higher reliability
▶ Coincidence of weekly/monthly pivot points and whale signals confirms important price points
• Moving Averages:
▶ Pay attention to whale signals near key moving averages (50MA, 200MA)
▶ Simultaneous occurrence of moving average breakouts and whale signals indicates important technical events
• Volume Profile:
▶ Whale activity near high volume nodes confirms important price levels
▶ Whale signals at low volume nodes may indicate possibility of rapid price movements
• Volatility Indicators:
▶ Whale signals after periods of low volatility may mark the beginning of new market movements
▶ Whale signals after Bollinger Band contraction may be precursors to large movements
• Market Structure:
▶ Whale signals near key market structures (higher highs/lows, lower highs/lows) suggest structural changes
▶ Coincidence of market structure changes and whale activity may signal important trend changes
─────────────────────────────────────
◆ Conclusion
52SIGNAL RECIPE Whale Smart Money Detector tracks the trading activities of large investors in the cryptocurrency market in real-time, providing traders with valuable insights. Because it can be applied to any cryptocurrency chart, you can utilize it immediately on your preferred trading platform.
The core value of this indicator is providing intuitive visualization of large fund flows that are easily missed by ordinary traders. By comprehensively analyzing volume surges, immediate price impacts, and trend continuity to accurately capture whale activity, you gain the opportunity to move alongside the big players in the market.
Clear buy/sell signals and real-time trend strength measurements help traders quickly grasp market conditions and understand market direction. By integrating this powerful tool into your trading system, gain insights into where the market's smart money is flowing for better market understanding.
─────────────────────────────────────
※ Disclaimer: Like all trading tools, the 52SIGNAL RECIPE Whale Smart Money Detector should be used as a supplementary indicator and not relied upon exclusively for trading decisions. Past patterns of whale behavior may not guarantee future market movements. Always employ appropriate risk management strategies in your trading.
52SIGNAL RECIPE Whale Smart Money Detector
◆ 개요
52SIGNAL RECIPE Whale Smart Money Detector는 암호화폐 시장에서 고래(대형 투자자)의 움직임을 실시간으로 감지하는 혁신적인 지표입니다. 이 강력한 도구는 시장에 큰 영향을 미치는 대규모 트레이딩 활동을 추적하여 중요한 시장 방향 전환이 일어나기 전에 귀중한 신호를 제공합니다. 모든 암호화폐 차트에 적용 가능하여 트레이더들이 언제 어디서든 대형 자금의 움직임을 따라갈 수 있게 해줍니다.
이 지표의 독보적인 강점은 거래량 급증, 가격 변동성, 그리고 추세 강도를 종합적으로 분석하여 고래의 시장 진입과 퇴출을 정확히 포착한다는 점입니다. 일반 트레이더들이 놓치기 쉬운 대형 자금의 흐름 데이터를 시각적으로 명확하게 제공함으로써, 여러분은 시장의 큰 손들과 함께 움직일 수 있는 기회를 얻게 됩니다.
─────────────────────────────────────
◆ 주요 특징
• 고래 활동 감지 시스템: 거래량 급증과 가격 임팩트를 분석하여 대형 투자자의 움직임을 실시간으로 포착
• 정밀한 거래량 분석: 일반 거래량과 고래 거래량을 구분하여 의미 있는 시장 움직임만 추적
• 시장 영향력 측정: 고래의 매수/매도가 시장에 미치는 실질적 영향력을 수치화하여 분석
• 연속성 추적: 고래 활동 이후 시장 방향의 지속성을 추적하여 신호의 유효성 확인
• 직관적 시각화: 컬러 바 차트와 명확한 라벨을 통해 고래 활동 지점을 쉽게 식별
• 추세 강도 표시: 현재 시장의 매수/매도 강도를 실시간으로 계산하여 테이블에 표시
• 고래 신호 필터링: 진정한 고래 활동만 감지하도록 다중 필터링 시스템 적용
• 맞춤형 감도 설정: 시장 상황에 따라 고래 감지 감도를 조절할 수 있는 유연한 파라미터 제공
─────────────────────────────────────
◆ 신호 유형 이해하기
■ 고래 매수 신호
• 정의: 거래량이 평균보다 크게 증가하고, 즉각적인 거래량 충격이 크며, 가격이 정상 변동성을 초과하여 상승할 때 발생
• 시각적 표현: 매수 신호가 발생한 캔들에 반투명 파란색 바 컬러링과 함께 "🐋Whale Buying Detected!" 라벨 표시
• 시장 해석: 대형 자금이 적극적으로 코인을 매수하고 있으며, 이는 곧 가격 상승으로 이어질 가능성이 높음을 의미
■ 고래 매도 신호
• 정의: 거래량이 평균보다 크게 증가하고, 즉각적인 거래량 충격이 크며, 가격이 정상 변동성을 초과하여 하락할 때 발생
• 시각적 표현: 매도 신호가 발생한 캔들에 반투명 분홍색 바 컬러링과 함께 "🐋Whale Selling Detected!" 라벨 표시
• 시장 해석: 대형 자금이 적극적으로 코인을 매도하고 있으며, 이는 곧 가격 하락으로 이어질 가능성이 높음을 의미
─────────────────────────────────────
◆ 추세 분석 이해하기
■ 추세 분석 방식
• 정의: 설정된 기간 동안의 상승/하락 캔들 비율을 분석하여 시장의 현재 추세와 강도를 측정
• 시각적 표현: 테이블에 "BUY"와 "SELL" 비율이 백분율로 표시되며, 현재 추세가 "BULLISH", "BEARISH" 또는 "NEUTRAL"로 명확하게 표시됨
• 계산 방식:
▶ 매수 비율 = (상승 캔들 수) / (전체 분석 기간)
▶ 매도 비율 = (하락 캔들 수) / (전체 분석 기간)
▶ 우세한 비율에 따라 "BULLISH" 또는 "BEARISH" 추세 결정
■ 추세 활용 방법
• 고래 신호 확인: 고래 신호가 현재 추세와 일치할 때 신호의 신뢰도가 높아짐
• 반전 포인트 식별: 강한 추세 속에서 발생하는 반대 방향의 고래 신호는 중요한 반전 포인트일 수 있음
• 시장 강도 평가: 매수/매도 비율을 통해 현재 시장의 세력 균형 파악
• 신호 발생 맥락 이해: 추세 정보와 고래 신호를 함께 고려하여 더 넓은 시장 컨텍스트에서 해석
─────────────────────────────────────
◆ 지표 설정 가이드
■ 주요 설정 매개변수
• Volume Impact Factor (거래량 임팩트 요소):
▶ 목적: 고래 활동으로 간주할 즉각적인 거래량 충격의 최소 배수 설정
▶ 낮은 값: 더 많은 신호 생성, 작은 고래도 감지
▶ 높은 값: 더 적은 신호, 매우 큰 고래만 감지
▶ 권장 범위: 2.0-4.0 (시장 상황에 따라 조정)
• Sensitivity Factor (민감도 요소):
▶ 목적: 정상 변동성 대비 가격 변동의 민감도 조절
▶ 낮은 값: 민감도 증가, 더 많은 신호 생성
▶ 높은 값: 민감도 감소, 더 강한 가격 충격만 감지
▶ 권장 범위: 0.2-0.5 (변동성이 높은 시장에서는 높게 설정)
• Trend Analysis Period (추세 분석 기간):
▶ 목적: 매수/매도 비율을 계산할 캔들 수 설정
▶ 낮은 값: 최근 추세에 더 민감하게 반응
▶ 높은 값: 더 긴 기간의 추세를 고려하여 안정적인 분석
▶ 권장 범위: 30-70 (트레이딩 스타일에 따라 조정)
─────────────────────────────────────
◆ 다른 지표와의 시너지
• 주요 지지/저항 레벨:
▶ 중요한 기술적 레벨 근처에서 발생하는 고래 신호는 더 높은 신뢰도를 가짐
▶ 주간/월간 피봇 포인트와 고래 신호의 일치는 중요한 가격 지점을 확인해줌
• 이동평균선:
▶ 주요 이동평균선(50MA, 200MA) 근처에서 발생하는 고래 신호에 주목
▶ 이동평균선 돌파와 고래 신호가 동시 발생 시 중요한 기술적 이벤트 확인
• 볼륨 프로필:
▶ 높은 볼륨 노드 근처에서의 고래 활동은 중요한 가격 레벨 확인
▶ 낮은 볼륨 노드에서 발생하는 고래 신호는 급격한 가격 이동 가능성 암시
• 변동성 지표:
▶ 낮은 변동성 구간 이후 발생하는 고래 신호는 새로운 시장 움직임의 시작일 수 있음
▶ 볼린저 밴드 수축 후 발생하는 고래 신호는 큰 움직임의 전조일 수 있음
• 시장 구조:
▶ 주요 시장 구조(높은 고점/저점, 낮은 고점/저점) 근처에서 발생하는 고래 신호는 구조 변화 암시
▶ 시장 구조 변화와 고래 활동의 일치는 중요한 트렌드 변화 신호일 수 있음
─────────────────────────────────────
◆ 결론
52SIGNAL RECIPE Whale Smart Money Detector는 암호화폐 시장에서 대형 투자자들의 거래 활동을 실시간으로 추적하여 트레이더들에게 귀중한 통찰력을 제공합니다. 모든 암호화폐 차트에 적용 가능하기 때문에, 여러분이 선호하는 트레이딩 플랫폼에서 바로 활용할 수 있습니다.
이 지표의 핵심 가치는 일반 트레이더들이 놓치기 쉬운 대형 자금의 흐름을 직관적으로 시각화하여 제공한다는 점입니다. 거래량 급증, 즉각적인 가격 충격, 그리고 추세 지속성을 종합적으로 분석하여 고래의 활동을 정확히 포착함으로써, 여러분은 시장을 움직이는 큰 손들과 함께할 수 있는 기회를 얻게 됩니다.
명확한 매수/매도 신호와 실시간 추세 강도 측정은 트레이더들이 시장 상황을 한눈에 파악하고 시장의 방향성을 이해하는 데 도움을 줍니다. 이 강력한 도구를 여러분의 트레이딩 시스템에 통합함으로써, 시장의 스마트 머니가 어디로 흘러가는지 파악하고 더 나은 통찰력을 얻으세요.
─────────────────────────────────────
※ 면책 조항: 모든 트레이딩 도구와 마찬가지로, 52SIGNAL RECIPE Whale Smart Money Detector는 보조 지표로 사용해야 하며 트레이딩 결정을 전적으로 의존해서는 안 됩니다. 과거의 고래 행동 패턴이 미래 시장 움직임을 보장하지는 않습니다. 항상 적절한 리스크 관리 전략을 트레이딩에 활용하세요.
◆ Overview
52SIGNAL RECIPE Whale Smart Money Detector is an innovative indicator that detects the movements of whales (large investors) in the cryptocurrency market in real-time. This powerful tool tracks large-scale trading activities that significantly impact the market, providing valuable signals before important market direction changes occur. It can be applied to any cryptocurrency chart, allowing traders to follow the movements of big money anytime, anywhere.
The unique strength of this indicator lies in its comprehensive analysis of volume surges, price volatility, and trend strength to accurately capture whale market entries and exits. By providing clear visual representation of large fund flow data that is difficult for ordinary traders to detect, you gain the opportunity to move alongside the big players in the market.
─────────────────────────────────────
◆ Key Features
• Whale Activity Detection System: Analyzes volume surges and price impacts to capture large investor movements in real-time
• Precise Volume Analysis: Distinguishes between regular volume and whale volume to track only meaningful market movements
• Market Impact Measurement: Quantifies and analyzes the real impact of whale buying/selling on the market
• Continuity Tracking: Follows market direction continuity after whale activity to confirm signal validity
• Intuitive Visualization: Easily identifies whale activity points through color bar charts and clear labels
• Trend Strength Display: Calculates and displays current market buy/sell strength in real-time in a table
• Whale Signal Filtering: Applies multiple filtering systems to detect only genuine whale activity
• Customizable Sensitivity Settings: Offers flexible parameters to adjust whale detection sensitivity according to market conditions
─────────────────────────────────────
◆ Understanding Signal Types
■ Whale Buy Signal
• Definition: Occurs when volume increases significantly above average, immediate volume impact is large, and price rises beyond normal volatility
• Visual Representation: Translucent blue bar coloring with "🐋Whale Buying Detected!" label on the candle where the buy signal occurs
• Market Interpretation: Indicates that large funds are actively buying the coin, which is likely to lead to price increases
■ Whale Sell Signal
• Definition: Occurs when volume increases significantly above average, immediate volume impact is large, and price falls beyond normal volatility
• Visual Representation: Translucent pink bar coloring with "🐋Whale Selling Detected!" label on the candle where the sell signal occurs
• Market Interpretation: Indicates that large funds are actively selling the coin, which is likely to lead to price decreases
─────────────────────────────────────
◆ Understanding Trend Analysis
■ Trend Analysis Method
• Definition: Measures current trend and strength by analyzing the ratio of up/down candles over a set period
• Visual Representation: Displayed in the table as "BUY" and "SELL" percentages, with the current trend clearly marked as "BULLISH", "BEARISH", or "NEUTRAL"
• Calculation Method:
▶ Buy ratio = (Number of up candles) / (Total analysis period)
▶ Sell ratio = (Number of down candles) / (Total analysis period)
▶ Current trend determined by the dominant ratio as "BULLISH" or "BEARISH"
■ Trend Utilization Methods
• Whale Signal Confirmation: Signal reliability increases when whale signals align with the current trend
• Reversal Point Identification: Opposing whale signals during strong trends may indicate important reversal points
• Market Strength Assessment: Understand the balance of power in the current market through buy/sell ratios
• Signal Context Understanding: Consider trend information alongside whale signals for interpretation in a broader market context
─────────────────────────────────────
◆ Indicator Settings Guide
■ Key Setting Parameters
• Volume Impact Factor:
▶ Purpose: Sets the minimum multiplier for immediate volume impact to be considered whale activity
▶ Lower values: Generate more signals, detect smaller whales
▶ Higher values: Fewer signals, detect only very large whales
▶ Recommended range: 2.0-4.0 (adjust according to market conditions)
• Sensitivity Factor:
▶ Purpose: Adjusts sensitivity of price movement relative to normal volatility
▶ Lower values: Increased sensitivity, more signals generated
▶ Higher values: Decreased sensitivity, only stronger price impacts detected
▶ Recommended range: 0.2-0.5 (set higher in highly volatile markets)
• Trend Analysis Period:
▶ Purpose: Sets the number of candles to calculate buy/sell ratios
▶ Lower values: More responsive to recent trends
▶ Higher values: More stable analysis considering longer-term trends
▶ Recommended range: 30-70 (adjust according to trading style)
─────────────────────────────────────
◆ Synergy with Other Indicators
• Key Support/Resistance Levels:
▶ Whale signals occurring near important technical levels have higher reliability
▶ Coincidence of weekly/monthly pivot points and whale signals confirms important price points
• Moving Averages:
▶ Pay attention to whale signals near key moving averages (50MA, 200MA)
▶ Simultaneous occurrence of moving average breakouts and whale signals indicates important technical events
• Volume Profile:
▶ Whale activity near high volume nodes confirms important price levels
▶ Whale signals at low volume nodes may indicate possibility of rapid price movements
• Volatility Indicators:
▶ Whale signals after periods of low volatility may mark the beginning of new market movements
▶ Whale signals after Bollinger Band contraction may be precursors to large movements
• Market Structure:
▶ Whale signals near key market structures (higher highs/lows, lower highs/lows) suggest structural changes
▶ Coincidence of market structure changes and whale activity may signal important trend changes
─────────────────────────────────────
◆ Conclusion
52SIGNAL RECIPE Whale Smart Money Detector tracks the trading activities of large investors in the cryptocurrency market in real-time, providing traders with valuable insights. Because it can be applied to any cryptocurrency chart, you can utilize it immediately on your preferred trading platform.
The core value of this indicator is providing intuitive visualization of large fund flows that are easily missed by ordinary traders. By comprehensively analyzing volume surges, immediate price impacts, and trend continuity to accurately capture whale activity, you gain the opportunity to move alongside the big players in the market.
Clear buy/sell signals and real-time trend strength measurements help traders quickly grasp market conditions and understand market direction. By integrating this powerful tool into your trading system, gain insights into where the market's smart money is flowing for better market understanding.
─────────────────────────────────────
※ Disclaimer: Like all trading tools, the 52SIGNAL RECIPE Whale Smart Money Detector should be used as a supplementary indicator and not relied upon exclusively for trading decisions. Past patterns of whale behavior may not guarantee future market movements. Always employ appropriate risk management strategies in your trading.
52SIGNAL RECIPE Whale Smart Money Detector
◆ 개요
52SIGNAL RECIPE Whale Smart Money Detector는 암호화폐 시장에서 고래(대형 투자자)의 움직임을 실시간으로 감지하는 혁신적인 지표입니다. 이 강력한 도구는 시장에 큰 영향을 미치는 대규모 트레이딩 활동을 추적하여 중요한 시장 방향 전환이 일어나기 전에 귀중한 신호를 제공합니다. 모든 암호화폐 차트에 적용 가능하여 트레이더들이 언제 어디서든 대형 자금의 움직임을 따라갈 수 있게 해줍니다.
이 지표의 독보적인 강점은 거래량 급증, 가격 변동성, 그리고 추세 강도를 종합적으로 분석하여 고래의 시장 진입과 퇴출을 정확히 포착한다는 점입니다. 일반 트레이더들이 놓치기 쉬운 대형 자금의 흐름 데이터를 시각적으로 명확하게 제공함으로써, 여러분은 시장의 큰 손들과 함께 움직일 수 있는 기회를 얻게 됩니다.
─────────────────────────────────────
◆ 주요 특징
• 고래 활동 감지 시스템: 거래량 급증과 가격 임팩트를 분석하여 대형 투자자의 움직임을 실시간으로 포착
• 정밀한 거래량 분석: 일반 거래량과 고래 거래량을 구분하여 의미 있는 시장 움직임만 추적
• 시장 영향력 측정: 고래의 매수/매도가 시장에 미치는 실질적 영향력을 수치화하여 분석
• 연속성 추적: 고래 활동 이후 시장 방향의 지속성을 추적하여 신호의 유효성 확인
• 직관적 시각화: 컬러 바 차트와 명확한 라벨을 통해 고래 활동 지점을 쉽게 식별
• 추세 강도 표시: 현재 시장의 매수/매도 강도를 실시간으로 계산하여 테이블에 표시
• 고래 신호 필터링: 진정한 고래 활동만 감지하도록 다중 필터링 시스템 적용
• 맞춤형 감도 설정: 시장 상황에 따라 고래 감지 감도를 조절할 수 있는 유연한 파라미터 제공
─────────────────────────────────────
◆ 신호 유형 이해하기
■ 고래 매수 신호
• 정의: 거래량이 평균보다 크게 증가하고, 즉각적인 거래량 충격이 크며, 가격이 정상 변동성을 초과하여 상승할 때 발생
• 시각적 표현: 매수 신호가 발생한 캔들에 반투명 파란색 바 컬러링과 함께 "🐋Whale Buying Detected!" 라벨 표시
• 시장 해석: 대형 자금이 적극적으로 코인을 매수하고 있으며, 이는 곧 가격 상승으로 이어질 가능성이 높음을 의미
■ 고래 매도 신호
• 정의: 거래량이 평균보다 크게 증가하고, 즉각적인 거래량 충격이 크며, 가격이 정상 변동성을 초과하여 하락할 때 발생
• 시각적 표현: 매도 신호가 발생한 캔들에 반투명 분홍색 바 컬러링과 함께 "🐋Whale Selling Detected!" 라벨 표시
• 시장 해석: 대형 자금이 적극적으로 코인을 매도하고 있으며, 이는 곧 가격 하락으로 이어질 가능성이 높음을 의미
─────────────────────────────────────
◆ 추세 분석 이해하기
■ 추세 분석 방식
• 정의: 설정된 기간 동안의 상승/하락 캔들 비율을 분석하여 시장의 현재 추세와 강도를 측정
• 시각적 표현: 테이블에 "BUY"와 "SELL" 비율이 백분율로 표시되며, 현재 추세가 "BULLISH", "BEARISH" 또는 "NEUTRAL"로 명확하게 표시됨
• 계산 방식:
▶ 매수 비율 = (상승 캔들 수) / (전체 분석 기간)
▶ 매도 비율 = (하락 캔들 수) / (전체 분석 기간)
▶ 우세한 비율에 따라 "BULLISH" 또는 "BEARISH" 추세 결정
■ 추세 활용 방법
• 고래 신호 확인: 고래 신호가 현재 추세와 일치할 때 신호의 신뢰도가 높아짐
• 반전 포인트 식별: 강한 추세 속에서 발생하는 반대 방향의 고래 신호는 중요한 반전 포인트일 수 있음
• 시장 강도 평가: 매수/매도 비율을 통해 현재 시장의 세력 균형 파악
• 신호 발생 맥락 이해: 추세 정보와 고래 신호를 함께 고려하여 더 넓은 시장 컨텍스트에서 해석
─────────────────────────────────────
◆ 지표 설정 가이드
■ 주요 설정 매개변수
• Volume Impact Factor (거래량 임팩트 요소):
▶ 목적: 고래 활동으로 간주할 즉각적인 거래량 충격의 최소 배수 설정
▶ 낮은 값: 더 많은 신호 생성, 작은 고래도 감지
▶ 높은 값: 더 적은 신호, 매우 큰 고래만 감지
▶ 권장 범위: 2.0-4.0 (시장 상황에 따라 조정)
• Sensitivity Factor (민감도 요소):
▶ 목적: 정상 변동성 대비 가격 변동의 민감도 조절
▶ 낮은 값: 민감도 증가, 더 많은 신호 생성
▶ 높은 값: 민감도 감소, 더 강한 가격 충격만 감지
▶ 권장 범위: 0.2-0.5 (변동성이 높은 시장에서는 높게 설정)
• Trend Analysis Period (추세 분석 기간):
▶ 목적: 매수/매도 비율을 계산할 캔들 수 설정
▶ 낮은 값: 최근 추세에 더 민감하게 반응
▶ 높은 값: 더 긴 기간의 추세를 고려하여 안정적인 분석
▶ 권장 범위: 30-70 (트레이딩 스타일에 따라 조정)
─────────────────────────────────────
◆ 다른 지표와의 시너지
• 주요 지지/저항 레벨:
▶ 중요한 기술적 레벨 근처에서 발생하는 고래 신호는 더 높은 신뢰도를 가짐
▶ 주간/월간 피봇 포인트와 고래 신호의 일치는 중요한 가격 지점을 확인해줌
• 이동평균선:
▶ 주요 이동평균선(50MA, 200MA) 근처에서 발생하는 고래 신호에 주목
▶ 이동평균선 돌파와 고래 신호가 동시 발생 시 중요한 기술적 이벤트 확인
• 볼륨 프로필:
▶ 높은 볼륨 노드 근처에서의 고래 활동은 중요한 가격 레벨 확인
▶ 낮은 볼륨 노드에서 발생하는 고래 신호는 급격한 가격 이동 가능성 암시
• 변동성 지표:
▶ 낮은 변동성 구간 이후 발생하는 고래 신호는 새로운 시장 움직임의 시작일 수 있음
▶ 볼린저 밴드 수축 후 발생하는 고래 신호는 큰 움직임의 전조일 수 있음
• 시장 구조:
▶ 주요 시장 구조(높은 고점/저점, 낮은 고점/저점) 근처에서 발생하는 고래 신호는 구조 변화 암시
▶ 시장 구조 변화와 고래 활동의 일치는 중요한 트렌드 변화 신호일 수 있음
─────────────────────────────────────
◆ 결론
52SIGNAL RECIPE Whale Smart Money Detector는 암호화폐 시장에서 대형 투자자들의 거래 활동을 실시간으로 추적하여 트레이더들에게 귀중한 통찰력을 제공합니다. 모든 암호화폐 차트에 적용 가능하기 때문에, 여러분이 선호하는 트레이딩 플랫폼에서 바로 활용할 수 있습니다.
이 지표의 핵심 가치는 일반 트레이더들이 놓치기 쉬운 대형 자금의 흐름을 직관적으로 시각화하여 제공한다는 점입니다. 거래량 급증, 즉각적인 가격 충격, 그리고 추세 지속성을 종합적으로 분석하여 고래의 활동을 정확히 포착함으로써, 여러분은 시장을 움직이는 큰 손들과 함께할 수 있는 기회를 얻게 됩니다.
명확한 매수/매도 신호와 실시간 추세 강도 측정은 트레이더들이 시장 상황을 한눈에 파악하고 시장의 방향성을 이해하는 데 도움을 줍니다. 이 강력한 도구를 여러분의 트레이딩 시스템에 통합함으로써, 시장의 스마트 머니가 어디로 흘러가는지 파악하고 더 나은 통찰력을 얻으세요.
─────────────────────────────────────
※ 면책 조항: 모든 트레이딩 도구와 마찬가지로, 52SIGNAL RECIPE Whale Smart Money Detector는 보조 지표로 사용해야 하며 트레이딩 결정을 전적으로 의존해서는 안 됩니다. 과거의 고래 행동 패턴이 미래 시장 움직임을 보장하지는 않습니다. 항상 적절한 리스크 관리 전략을 트레이딩에 활용하세요.
Skrip dilindungi
Skrip ini diterbitkan sebagai sumber tertutup. Akan tetapi, anda boleh menggunakannya secara bebas dan tanpa apa-apa had – ketahui lebih di sini.
Penafian
Maklumat dan penerbitan adalah tidak bertujuan, dan tidak membentuk, nasihat atau cadangan kewangan, pelaburan, dagangan atau jenis lain yang diberikan atau disahkan oleh TradingView. Baca lebih dalam Terma Penggunaan.