OPEN-SOURCE SCRIPT
Telah dikemas kini Econometrica by [SS]
This is Econometrica, an indicator that aims to bridge a big gap between the resources available for analysis of fundamental data and its impact on tickers and price action.
I have noticed a general dearth of available indicators that offer insight into how fundamentals impact a ticker and provide guidance on how they these economic factors influence ticker behaviour.
Enter Econometrica. Econometrica is a math based indicator that aims to co-integrate and model indicator price action in relation to critical economic metrics.
Econometrica supports the following US based economic data:
Let's go over the functions of Econometrica.
Creating a Regression Cointegrated Model
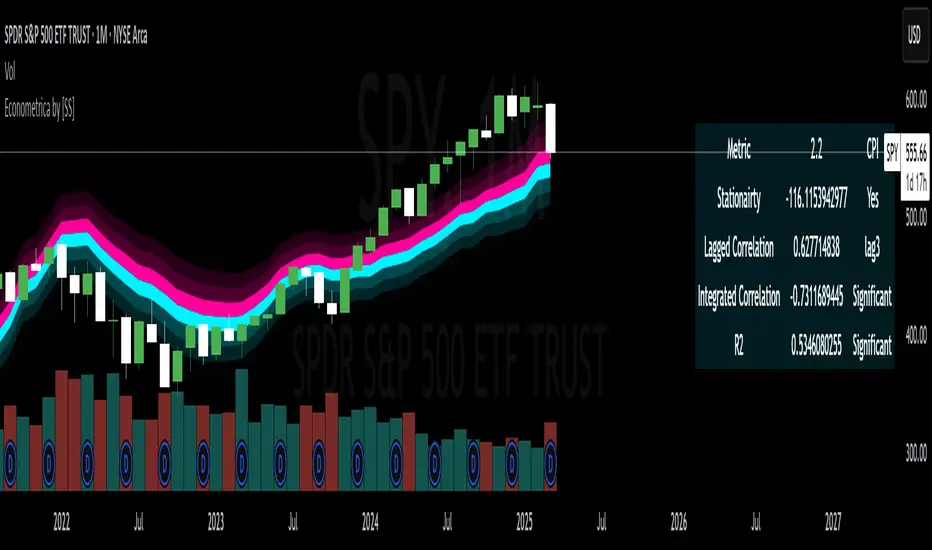
The first thing Econometrica does is creates a co-integrated regression, as you see in the main chart, predicting ticker value ranges from fundamental economic data.
You can visualize this in the main chart above, but here are some other examples:
SPY vs Core Inflation:

BA vs PCE:

QQQ vs US Balance Sheet:

The band represents the anticipated range the ticker should theoretically fall in based on the underlying economic value. The indicator will breakdown the relationship between the economic indicator and the ticker more precisely. In the images above, you can see how there are some metrics provided, including Stationairty, lagged correlation, Integrated Correlation and R2. Let's discuss these very briefly:
Explaining the Relationship
Owning to the fact that the indicator is a bit on the mathy side (it has to be to do this kind of task), I have included ability for the indicator to explain and make suggestions based on the underlying data. It can assess the model's fit and make suggestions for tweaking. It can also explain the implications of the data being presented in the model.
Here is an example with QQQ and the US Balance Sheet:

This helps to simplify and interpret the results you are looking at.
Forecasting the Economic Indicator
In addition to assessing the economic indicator's impact on the ticker, the indicator is also capable of forecasting out the economic indicator over the next 25 releases.
Here is an example of the CPI forecast:

Overall use of the indicator
The indicator is meant to bridge the gap between Technical Analysis and Fundamental Analysis.
Any trader who is attune to fundamentals would benefit from this, as this provides you with objective data on how and to what extent fundamental and economic data impacts tickers.
It can help affirm hypothesis and dispel myths objectively.
It also omits the need from having to perform these types of analyses outside of Tradingview (i.e. in excel, R or Python), as you can get the data in just a few licks of enabling the indicator.
Conclusion
I have tried to make this indicator as user friendly as possible. Though it uses a lot of math, it is fairly straight forward to interpret.
The band plotted can be considered the fair market value or FMV of the ticker based on the underlying economic data, provided the indicator tells you that the relationship is significant (and it will blatantly give you this information verbatim, you don't have to interpret the math stuff).
This is US economic data only. It does not pull economic data from other countries. You can absolutely see how US economic data impacts other markets like the TSX, BANKNIFTY, NIFTY, DAX etc. but the indicator is only pulling US economic data.
That is it!
I hope you enjoy it and find this helpful!
Thanks everyone and safe trades as always 🚀🚀🚀
I have noticed a general dearth of available indicators that offer insight into how fundamentals impact a ticker and provide guidance on how they these economic factors influence ticker behaviour.
Enter Econometrica. Econometrica is a math based indicator that aims to co-integrate and model indicator price action in relation to critical economic metrics.
Econometrica supports the following US based economic data:
- CPI
- Non-Farm Payroll
- Core Inflation
- US Money Supply
- US Central Bank Balance Sheet
- GDP
- PCE
Let's go over the functions of Econometrica.
Creating a Regression Cointegrated Model
The first thing Econometrica does is creates a co-integrated regression, as you see in the main chart, predicting ticker value ranges from fundamental economic data.
You can visualize this in the main chart above, but here are some other examples:
SPY vs Core Inflation:
BA vs PCE:
QQQ vs US Balance Sheet:
The band represents the anticipated range the ticker should theoretically fall in based on the underlying economic value. The indicator will breakdown the relationship between the economic indicator and the ticker more precisely. In the images above, you can see how there are some metrics provided, including Stationairty, lagged correlation, Integrated Correlation and R2. Let's discuss these very briefly:
- Stationarity: checks to ensure that the relationship between the economic indicator and ticker is stationary. Stationary data is important for making unbiased inferences and projections, so having data that is stationary is valuable.
- Lagged Correlation: This is a very interesting metric. Lagged correlation means whether there is a delay in the economic indicator and the response of the ticker. Typically, you will observed a lagged correlation between an economic indicator and price of a ticker, as it can take some time for economic changes to reach the market. This lagged correlation will provide you with how long it takes for the economic indicator to catch up with the ticker in months.
- Integrated Correlation: This metric tells you how good of a fit the regression bands are in relation to the ticker price. A higher correlation, means the model is better at consistent and accurate information about the anticipated range for the ticker in relation to the economic indicator.
- R2: Provides information on the variance and degree of model fit. A high R2 value means that the model is capable of explaining a large amount of variance between the economic indicator and the ticker price action.
Explaining the Relationship
Owning to the fact that the indicator is a bit on the mathy side (it has to be to do this kind of task), I have included ability for the indicator to explain and make suggestions based on the underlying data. It can assess the model's fit and make suggestions for tweaking. It can also explain the implications of the data being presented in the model.
Here is an example with QQQ and the US Balance Sheet:
This helps to simplify and interpret the results you are looking at.
Forecasting the Economic Indicator
In addition to assessing the economic indicator's impact on the ticker, the indicator is also capable of forecasting out the economic indicator over the next 25 releases.
Here is an example of the CPI forecast:
Overall use of the indicator
The indicator is meant to bridge the gap between Technical Analysis and Fundamental Analysis.
Any trader who is attune to fundamentals would benefit from this, as this provides you with objective data on how and to what extent fundamental and economic data impacts tickers.
It can help affirm hypothesis and dispel myths objectively.
It also omits the need from having to perform these types of analyses outside of Tradingview (i.e. in excel, R or Python), as you can get the data in just a few licks of enabling the indicator.
Conclusion
I have tried to make this indicator as user friendly as possible. Though it uses a lot of math, it is fairly straight forward to interpret.
The band plotted can be considered the fair market value or FMV of the ticker based on the underlying economic data, provided the indicator tells you that the relationship is significant (and it will blatantly give you this information verbatim, you don't have to interpret the math stuff).
This is US economic data only. It does not pull economic data from other countries. You can absolutely see how US economic data impacts other markets like the TSX, BANKNIFTY, NIFTY, DAX etc. but the indicator is only pulling US economic data.
That is it!
I hope you enjoy it and find this helpful!
Thanks everyone and safe trades as always 🚀🚀🚀
Nota Keluaran
Some fine tweaking to improve user experience. Nota Keluaran
FixSkrip sumber terbuka
Dalam semangat TradingView sebenar, pencipta skrip ini telah menjadikannya sumber terbuka, jadi pedagang boleh menilai dan mengesahkan kefungsiannya. Terima kasih kepada penulis! Walaupuan anda boleh menggunakan secara percuma, ingat bahawa penerbitan semula kod ini tertakluk kepada Peraturan Dalaman.
Get:
- Live Updates,
- Discord access,
- Access to my Proprietary Merlin Software,
- Access to premium indicators,
patreon.com/steversteves
Now on X!
- Live Updates,
- Discord access,
- Access to my Proprietary Merlin Software,
- Access to premium indicators,
patreon.com/steversteves
Now on X!
Penafian
Maklumat dan penerbitan adalah tidak bertujuan, dan tidak membentuk, nasihat atau cadangan kewangan, pelaburan, dagangan atau jenis lain yang diberikan atau disahkan oleh TradingView. Baca lebih dalam Terma Penggunaan.
Skrip sumber terbuka
Dalam semangat TradingView sebenar, pencipta skrip ini telah menjadikannya sumber terbuka, jadi pedagang boleh menilai dan mengesahkan kefungsiannya. Terima kasih kepada penulis! Walaupuan anda boleh menggunakan secara percuma, ingat bahawa penerbitan semula kod ini tertakluk kepada Peraturan Dalaman.
Get:
- Live Updates,
- Discord access,
- Access to my Proprietary Merlin Software,
- Access to premium indicators,
patreon.com/steversteves
Now on X!
- Live Updates,
- Discord access,
- Access to my Proprietary Merlin Software,
- Access to premium indicators,
patreon.com/steversteves
Now on X!
Penafian
Maklumat dan penerbitan adalah tidak bertujuan, dan tidak membentuk, nasihat atau cadangan kewangan, pelaburan, dagangan atau jenis lain yang diberikan atau disahkan oleh TradingView. Baca lebih dalam Terma Penggunaan.