OPEN-SOURCE SCRIPT
Telah dikemas kini NQ–2Y Correlation
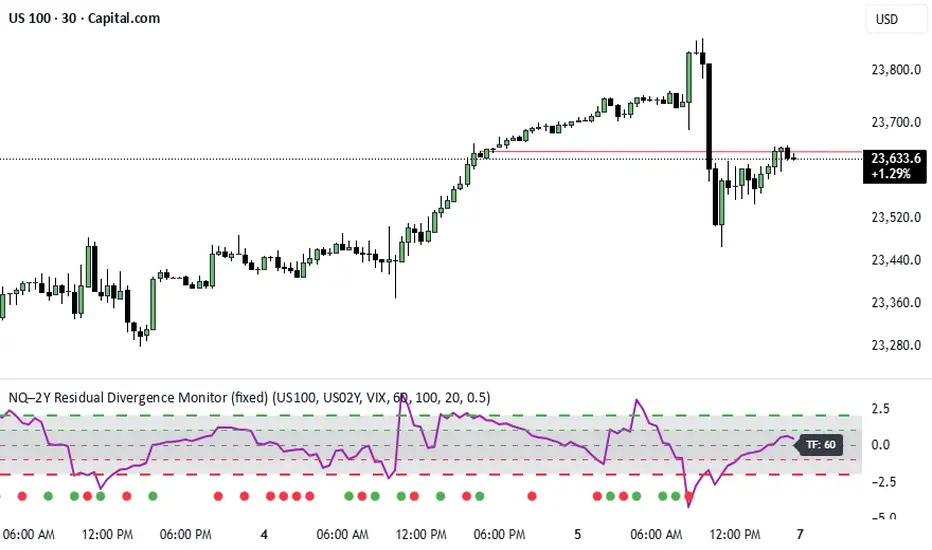
This indicator tracks the relationship between the Nasdaq futures (NQ) and the US 2-Year Treasury yield (US02Y). The two typically move in opposite directions. This tool highlights when that relationship breaks down, and when moves become stretched to extremes. This can be useful for traders to find inflection points in price representing either overbought or oversold extremes.
Key Features
Residual Z-Score: Shows how far NQ’s returns deviate from what would be expected given moves in the 2Y. Useful for spotting stretched conditions (+/- 2σ bands).
Correlation Tracking: Fast and slow correlations between NQ and inverted 2Y returns. Helps identify regime shifts in the relationship.
Same-Direction Signals: Green dots mark when NQ and 2Y both move strongly in the same direction (rare alignment). Red dots mark strong opposing moves.
Alerts: Triggers available for residual stretches, correlation flips, and significant same-direction or opposite moves.
Usage
Monitor Z-Score to identify when the equity–rates linkage is stretched beyond typical bounds. I typically use this on the H1 or H4 timeframe.
Watch for correlation regime shifts to spot changing market dynamics. Typically price falling into support or moving into resistance as there is a false correlation or a flip.
Same-direction dots help flag unusual synchronized moves between risk assets and yields - these are especially useful for identifying false moves.
Nota Keluaran
What is the 2 year yield?The 2 year yield is the rate the US Government pays to borrow money over a 2 year period. The yield is the interest they promise to pay. The higher the yield, the higher the premium a lender gets for the money loan the US Government. The 2 year yield is also a broader indicator for short term loan costs across the market, so acts as indicator for how loose (lower yield) or tight (higher yield) financial conditions are.
Going up - thermostat in the economy rising (market is anticipating higher borrowing costs, likely through FED rate increases)
Going down - loosening, borrowing costs going down, likely in anticipation of lower rates.
Why watch it with the Nasdaq 100 (NQ)?
For funds, institutions, trading desks etc, it is the pulse of the market. Equities desks will watch it because higher 2 year rate increases the discount rate, and therefore leads sells offs in tech sensitive sectors, like NQ (the Nasdaq 100 futures). Equally, lower 2 year yields indicate cheaper borrowing, risk off and higher prices for growth assets.
Summary:
- The 2YR is the messenger of Fed policy.
- A rising 2YR is treated as a warning siren for risk assets.
- A falling 2YR is treated as a green light for risk-on trades.
How is the indicator designed?
Now we know there is a correlation between the 2 year yield and NQ and we know it is an inverse correlation (2 year down = NQ up), we have a relationship. This indicator is designed to show you the normal relationship between the 2 year and NQ and when this deviates from the normal relationship.
A Z-score is used to calculate this. Think of a Z score like walking into a pizza place and ordering your favourite pizza. You have an idea of what that should cost you in your local pizza place (that's 0 on the standard deviation). But one day it comes out 20 dollars higher and you think, "no way is that OK to pay for a pizza" - that's like 2 standard deviations above what you would expect. Then the next day it comes out 20 dollars less than you think and you say to yourself, "I'll buy four at that price, wow!"
The same is true for this Z score. The 2 year is a leading indicator. The standard deviation is -2 - 0 - +2. So if the Z score is +2 you know NQ is running way ahead of what the 2 year say would be normal and if at -2 you are way below what should be normal.
In addition to that, the indicator tells you when this relationship is not normal. In other words, when the 2 year and NQ are moving in the same direction. They shouldn't and one will usually revert. so it can be a sign of a false move.
How to use the indicator in trading? Use cases:
Set indicator settings to min. 60 mins. It will show up on your chart on a lower time frame as 60 mins. I tend not to use it on lower than 30 mins, but 60 removes a lot of noise.
Use only after 08:00 am EST and before 15:00 EST. this is when the bond markets have the most liquidity.
Trend-confirmation mode
Condition: resid_z rising and making higher highs and higher lows (e.g. > +0.5) while NQ is making higher highs/higher lows.Improved with a green dot saying 2 year and NQ are moving in unison.
Meaning: Price strength is supported relative to the rate-model — the market is “agreeing” with the driver.
Action: bias with trend (pullback entries).
Bullish divergence
Bullish divergence (price up, resid_z down)
Condition: resid_z makes a lower low while NQ makes a higher low; resid_z < −1 (stronger if < −2).
Meaning: Price shows strength despite the model implying weakness → buyers absorbing pressure or a short-term decoupling.
Action: treat as probable bullish continuation if price confirms (break above recent high) or trade conservatively on reclaim with smaller size. Check VIX: if VIX unison dot present, reduce conviction.
Bearish divergence (price down, resid_z up)
Condition: NQ makes lower low while resid_z makes a higher low; resid_z > +1 helpful.
Meaning: Price weakness may be an overshoot vs what yields predict — possible bear trap or selling for non-rate reasons.
Action: wait for confirmation. If price recovers above the breakdown, consider long; if VIX confirms and price continues with volume, favour continuation short.
Same-direction 2Y/NQ dot — treat as a false move
Condition: red same-dir dot (NQ & 2Y move same way strongly).
Meaning: Fundamental inverse relationship temporarily broken
Action: treat as a false move. Look for a liquidity grab or a move into support or resistance.
Skrip sumber terbuka
Dalam semangat TradingView sebenar, pencipta skrip ini telah menjadikannya sumber terbuka, jadi pedagang boleh menilai dan mengesahkan kefungsiannya. Terima kasih kepada penulis! Walaupuan anda boleh menggunakan secara percuma, ingat bahawa penerbitan semula kod ini tertakluk kepada Peraturan Dalaman.
Penafian
Maklumat dan penerbitan adalah tidak bertujuan, dan tidak membentuk, nasihat atau cadangan kewangan, pelaburan, dagangan atau jenis lain yang diberikan atau disahkan oleh TradingView. Baca lebih dalam Terma Penggunaan.