OPEN-SOURCE SCRIPT
TASC 2024.11 Ultimate Strength Index
█ OVERVIEW
This script implements the Ultimate Strength Index (USI) indicator, introduced by John Ehlers in his article titled "Ultimate Strength Index (USI)" from the November 2024 edition of TASC's Traders' Tips. The USI is a modified version of Wilder's original Relative Strength Index (RSI) that incorporates Ehlers' UltimateSmoother lowpass filter to produce an output with significantly reduced lag.
█ CONCEPTS
Many technical indicators, including the RSI, lag due to their heavy reliance on historical data. John Ehlers reformulated the RSI to substantially reduce lag by applying his UltimateSmoother filter to upward movements (strength up - SU) and downward movements (strength down - SD) in the time series, replacing the standard process of smoothing changes with rolling moving averages (RMAs). Ehlers' recent works, covered in our recent script publications, have shown that the UltimateSmoother is an effective alternative to other classic averages, offering notably less lag in its response.
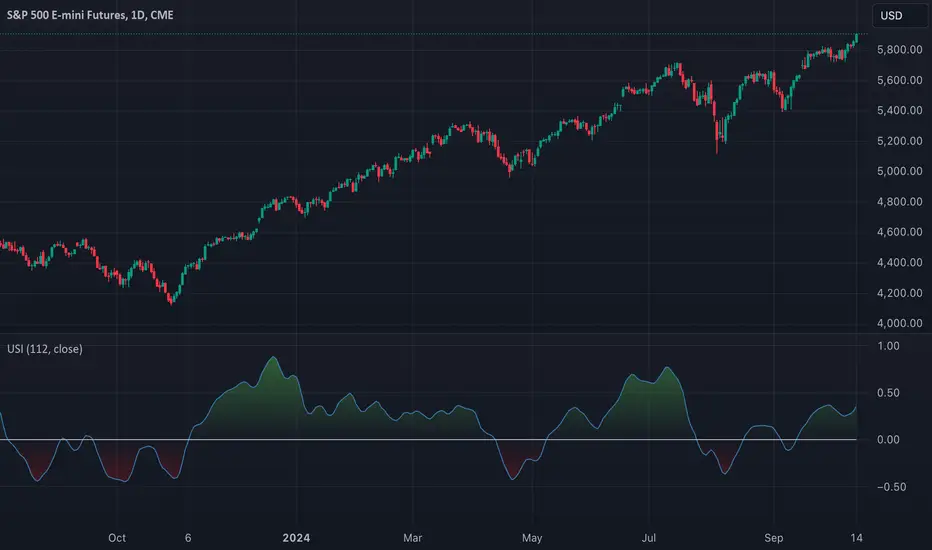
Ehlers also modified the RSI formula to produce an index that ranges from -1 to +1 instead of 0 to 100. As a result, the USI indicates bullish conditions when its value moves above 0 and bearish conditions when it falls below 0.
The USI retains many of the strengths of the traditional RSI while offering the advantage of reduced lag. It generally uses a larger lookback window than the conventional RSI to achieve similar behavior, making it suitable for trend trading with longer data lengths. When applied with shorter lengths, the USI's peaks and valleys tend to align closely with significant turning points in the time series, making it a potentially helpful tool for timing swing trades.
█ CALCULATIONS
The first step in the USI's calculation is determining each bar's strength up (SU) and strength down (SD) values. If the current bar's close exceeds the previous bar's, the calculation assigns the difference to SU. Otherwise, SU is zero. Likewise, if the current bar's close is below the previous bar's, it assigns the difference to SD. Otherwise, SD is zero.
Next, instead of the RSI's typical smoothing process, the USI's calculation applies the UltimateSmoother to the short-term average SU and SD values, reducing high-frequency chop in the series with low lag.
Finally, this formula determines the USI value:
USI = (Ult(SU) − Ult(SD)) / (Ult(SU) + Ult(SD)),
where Ult(SU) and Ult(SD) are the smoothed average strength up and strength down values.
This script implements the Ultimate Strength Index (USI) indicator, introduced by John Ehlers in his article titled "Ultimate Strength Index (USI)" from the November 2024 edition of TASC's Traders' Tips. The USI is a modified version of Wilder's original Relative Strength Index (RSI) that incorporates Ehlers' UltimateSmoother lowpass filter to produce an output with significantly reduced lag.
█ CONCEPTS
Many technical indicators, including the RSI, lag due to their heavy reliance on historical data. John Ehlers reformulated the RSI to substantially reduce lag by applying his UltimateSmoother filter to upward movements (strength up - SU) and downward movements (strength down - SD) in the time series, replacing the standard process of smoothing changes with rolling moving averages (RMAs). Ehlers' recent works, covered in our recent script publications, have shown that the UltimateSmoother is an effective alternative to other classic averages, offering notably less lag in its response.
Ehlers also modified the RSI formula to produce an index that ranges from -1 to +1 instead of 0 to 100. As a result, the USI indicates bullish conditions when its value moves above 0 and bearish conditions when it falls below 0.
The USI retains many of the strengths of the traditional RSI while offering the advantage of reduced lag. It generally uses a larger lookback window than the conventional RSI to achieve similar behavior, making it suitable for trend trading with longer data lengths. When applied with shorter lengths, the USI's peaks and valleys tend to align closely with significant turning points in the time series, making it a potentially helpful tool for timing swing trades.
█ CALCULATIONS
The first step in the USI's calculation is determining each bar's strength up (SU) and strength down (SD) values. If the current bar's close exceeds the previous bar's, the calculation assigns the difference to SU. Otherwise, SU is zero. Likewise, if the current bar's close is below the previous bar's, it assigns the difference to SD. Otherwise, SD is zero.
Next, instead of the RSI's typical smoothing process, the USI's calculation applies the UltimateSmoother to the short-term average SU and SD values, reducing high-frequency chop in the series with low lag.
Finally, this formula determines the USI value:
USI = (Ult(SU) − Ult(SD)) / (Ult(SU) + Ult(SD)),
where Ult(SU) and Ult(SD) are the smoothed average strength up and strength down values.
Skrip sumber terbuka
Dalam semangat TradingView sebenar, pencipta skrip ini telah menjadikannya sumber terbuka, jadi pedagang boleh menilai dan mengesahkan kefungsiannya. Terima kasih kepada penulis! Walaupuan anda boleh menggunakan secara percuma, ingat bahawa penerbitan semula kod ini tertakluk kepada Peraturan Dalaman.
Tools and ideas for all Pine coders: tradingview.com/u/PineCoders/
TASC: traders.com/
TASC: traders.com/
Penafian
Maklumat dan penerbitan adalah tidak bertujuan, dan tidak membentuk, nasihat atau cadangan kewangan, pelaburan, dagangan atau jenis lain yang diberikan atau disahkan oleh TradingView. Baca lebih dalam Terma Penggunaan.