PROTECTED SOURCE SCRIPT
10Y - 2Y Spread (Farbig)
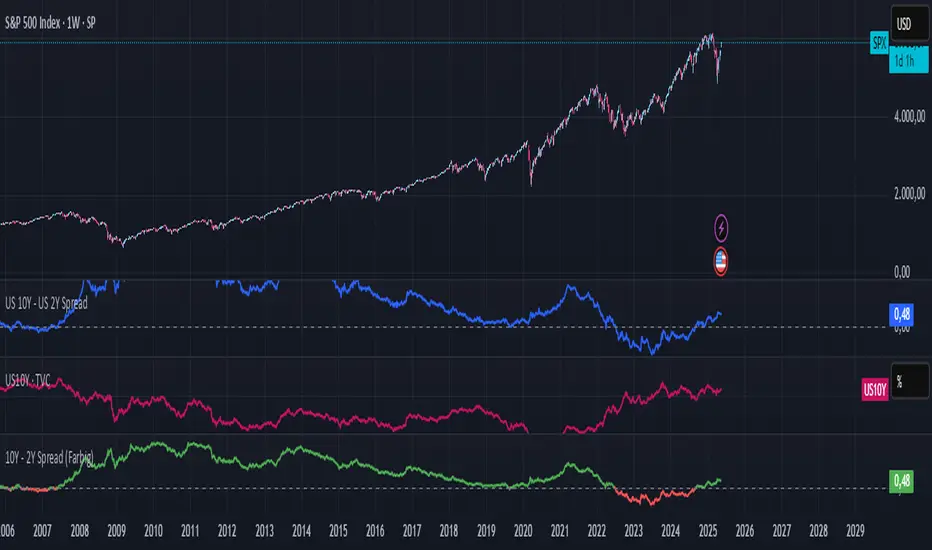
10Y – 2Y Yield Spread (Color-Coded)
Description:
This indicator plots the yield spread between the US 10-Year and 2-Year Treasury yields (US10Y – US02Y) as a color-coded line:
Green = normal yield curve (positive spread)
Red = inverted yield curve (negative spread), often seen as a leading recession signal
A horizontal zero line is added to highlight turning points.
This indicator is ideal for tracking macroeconomic yield curve behavior and can be used alongside equity, crypto, or commodity charts.
Skrip dilindungi
Skrip ini diterbitkan sebagai sumber tertutup. Akan tetapi, anda boleh menggunakannya secara bebas dan tanpa apa-apa had – ketahui lebih di sini.
Penafian
Maklumat dan penerbitan adalah tidak bertujuan, dan tidak membentuk, nasihat atau cadangan kewangan, pelaburan, dagangan atau jenis lain yang diberikan atau disahkan oleh TradingView. Baca lebih dalam Terma Penggunaan.