OPEN-SOURCE SCRIPT
Fixed Volatility Oscillator
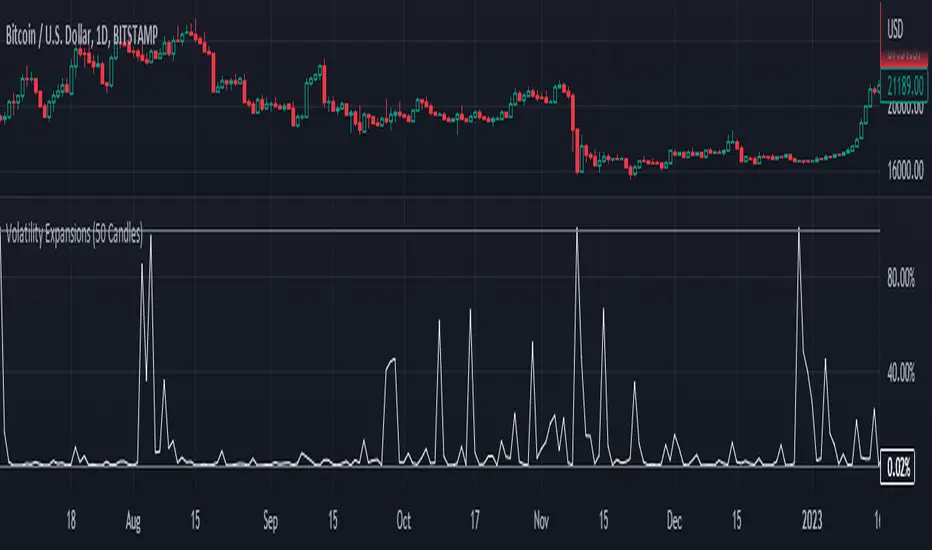
A fixed volatility plotter set to a 0-100 range - Plots the current volatility % using the formula to calculate volatility and stdev (standard deviation) based on the candle lookback.
The indicator is Fixed, which means that regardless of the chart, the volatility will be plotted on a percentage of 0% - 100% with a 101% threshold set to indicate a volatility reset. While the volume of volatility will change depending on the chart, the volatility will ALWAYS stay within this range.
if a plot exceeds 100% it should be marked as volatility reset - not an expansion
and should also be noted that the volatility spikes are also very inconsistent in volume and vary greatly.
The candle lookbacks on standard are organized be from 10 candles to 100 candles. I found the best results using the 50 candles lookback, and therefore have set it as the default value. These different values can be used to pull the information from the # of candles on the selected option - and therefore the volatility will be calculated from the number of candles selected.
// note for other people versed in pinescript
While this indicator may be useful in trading or strategies, it is more meant to incorporated into other scripts or used as a basis that can be further expanded on. The visuals are not built at all - for that purpose.
This script has not been listed as a library for the fact that it can be used as an actual indicator within a strategy - hope you enjoy.
Skrip sumber terbuka
Dalam semangat TradingView sebenar, pencipta skrip ini telah menjadikannya sumber terbuka, jadi pedagang boleh menilai dan mengesahkan kefungsiannya. Terima kasih kepada penulis! Walaupuan anda boleh menggunakan secara percuma, ingat bahawa penerbitan semula kod ini tertakluk kepada Peraturan Dalaman.
Penafian
Maklumat dan penerbitan adalah tidak bertujuan, dan tidak membentuk, nasihat atau cadangan kewangan, pelaburan, dagangan atau jenis lain yang diberikan atau disahkan oleh TradingView. Baca lebih dalam Terma Penggunaan.