PROTECTED SOURCE SCRIPT
Telah dikemas kini SD Trend with Signals
SD Trend Indicator
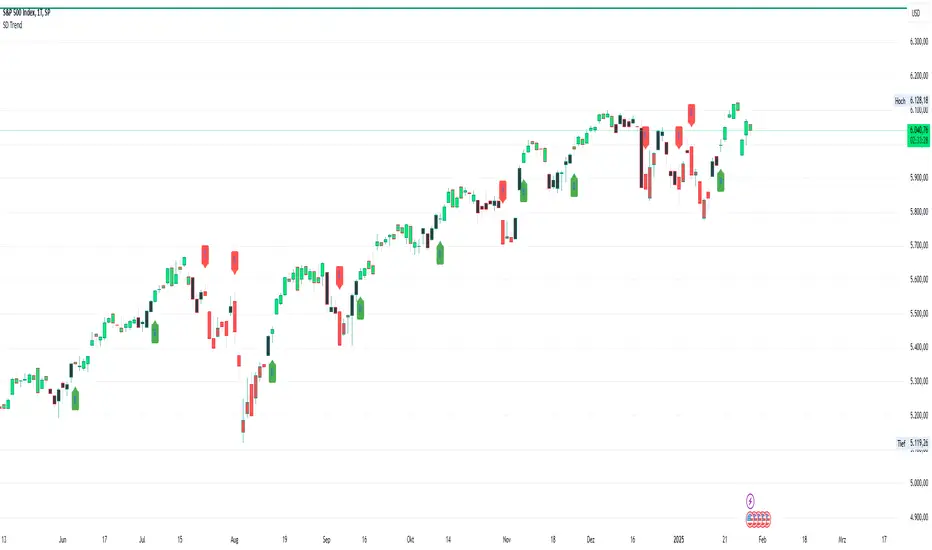
The SD Trend Indicator is a trend-following tool designed to help traders identify potential buy and sell signals based on a combination of technical indicators: MACD, RSI, and Stochastic Oscillator. It visually enhances price action by color-coding candles and plotting signals when a trend shift occurs.
How It Works:
MACD (12, 26, 9): Measures momentum and trend direction.
RSI (7): Identifies overbought and oversold conditions.
Stochastic Oscillator (14, 3, 3): Confirms trend strength and reversals.
Candle Color Coding:
Green → Bullish (Buy Condition)
Red → Bearish (Sell Condition)
Black → Neutral (No Trade)
Signal Generation:
A Buy Signal (B) is plotted below the first green candle after a neutral (black) phase.
A Sell Signal (S) is plotted above the first red candle after a neutral (black) phase.
This helps traders capture early trend reversals with clear visual confirmation.
Key Features:
✔️ Trend Confirmation using three proven indicators.
✔️ Clear Candle Coloring for easy trend visualization.
✔️ Buy/Sell Labels (B/S) for quick decision-making.
✔️ Works on any timeframe and asset class (stocks, forex, crypto, etc.).
This indicator is ideal for traders looking to follow trends, identify potential reversals, and improve entry/exit timing with a systematic approach
Nota Keluaran
SD Trend IndicatorThe SD Trend Indicator is a trend-following tool designed to help traders identify potential buy and sell signals based on a combination of technical indicators: MACD, RSI, and Stochastic Oscillator. It visually enhances price action by color-coding candles and plotting signals when a trend shift occurs.
How It Works:
MACD (12, 26, 9): Measures momentum and trend direction.
RSI (7): Identifies overbought and oversold conditions.
Stochastic Oscillator (14, 3, 3): Confirms trend strength and reversals.
Candle Color Coding:
Green → Bullish (Buy Condition)
Red → Bearish (Sell Condition)
Black → Neutral (No Trade)
Signal Generation:
A Buy Signal (B) is plotted below the first green candle after a neutral (black) phase.
A Sell Signal (S) is plotted above the first red candle after a neutral (black) phase.
This helps traders capture early trend reversals with clear visual confirmation.
Key Features:
✔️ Trend Confirmation using three proven indicators.
✔️ Clear Candle Coloring for easy trend visualization.
✔️ Buy/Sell Labels (B/S) for quick decision-making.
✔️ Works on any timeframe and asset class (stocks, forex, crypto, etc.).
This indicator is ideal for traders looking to follow trends, identify potential reversals, and improve entry/exit timing with a systematic approach
***UPDATE***
- updated to pine script version 6.0
- new alarm function to set alarms every time a new green candle is plotted!
Skrip dilindungi
Skrip ini diterbitkan sebagai sumber tertutup. Akan tetapi, anda boleh menggunakannya secara bebas dan tanpa apa-apa had – ketahui lebih di sini.
Penafian
Maklumat dan penerbitan adalah tidak bertujuan, dan tidak membentuk, nasihat atau cadangan kewangan, pelaburan, dagangan atau jenis lain yang diberikan atau disahkan oleh TradingView. Baca lebih dalam Terma Penggunaan.