OPEN-SOURCE SCRIPT
RTH Open ± Ø DailyRange (wintertime)
verview
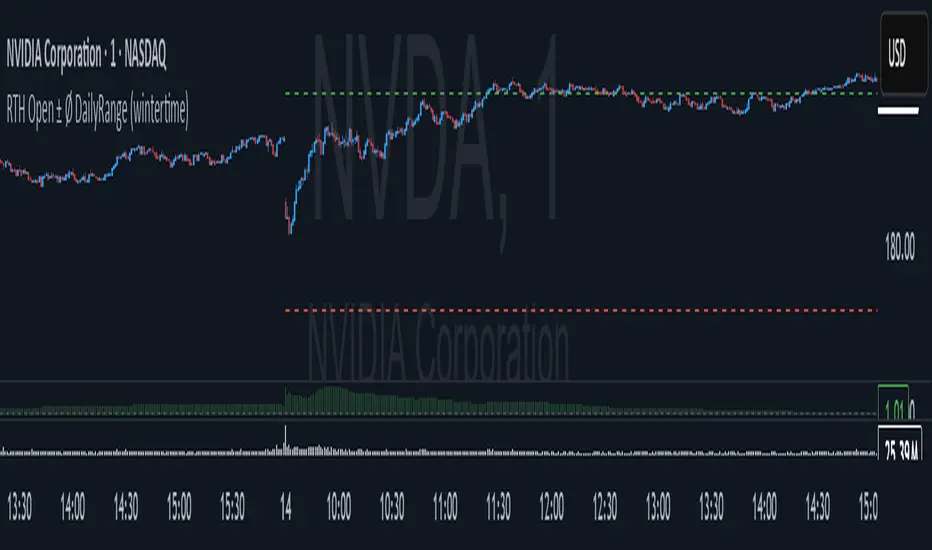
The script draws two horizontal lines on your chart based on the RTH Open (Regular Trading Hours start at 09:00 CET, winter time). These lines are offset by the average daily range (the average of the last 10 days’ high–low range). The lines begin at the first bar of the RTH session and extend dynamically to the current bar.
The script draws two horizontal lines on your chart based on the RTH Open (Regular Trading Hours start at 09:00 CET, winter time). These lines are offset by the average daily range (the average of the last 10 days’ high–low range). The lines begin at the first bar of the RTH session and extend dynamically to the current bar.
Skrip sumber terbuka
In true TradingView spirit, the creator of this script has made it open-source, so that traders can review and verify its functionality. Kudos to the author! While you can use it for free, remember that republishing the code is subject to our House Rules.
Penafian
The information and publications are not meant to be, and do not constitute, financial, investment, trading, or other types of advice or recommendations supplied or endorsed by TradingView. Read more in the Terms of Use.