PROTECTED SOURCE SCRIPT
Telah dikemas kini Forex Pairs Relative Analysis and Suggestions
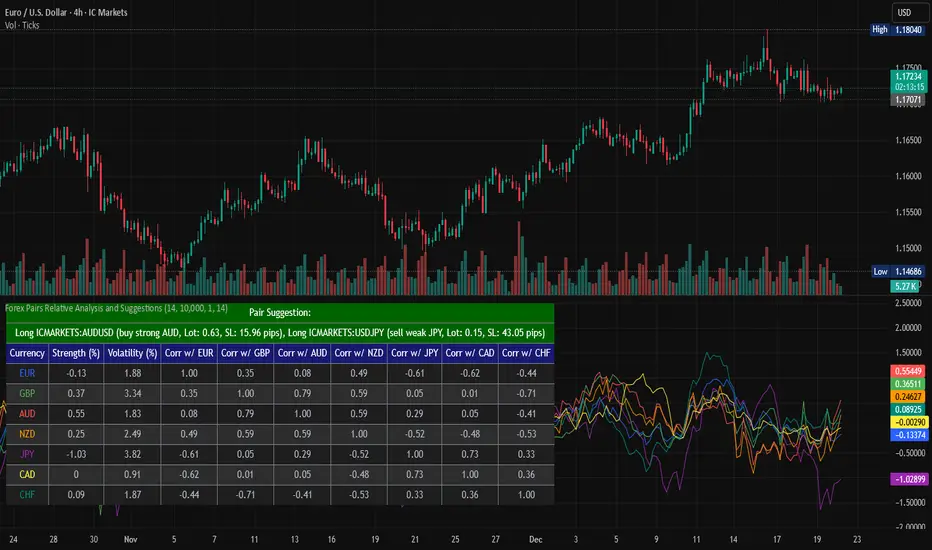
This Pine Script (version 5) indicator, titled "Forex Pairs Relative Analysis and Suggestions," is designed for use on TradingView charts. It provides real-time analysis of major forex pairs sourced from the IC Markets exchange, facilitating relative value or pair trading strategies by evaluating currency strengths against the US Dollar (USD). The script focuses on seven major currencies—EUR, GBP, AUD, NZD, JPY, CAD, and CHF—through their respective pairs: EURUSD, GBPUSD, AUDUSD, NZDUSD, USDJPY, USDCAD, and USDCHF.
Key features include:
Relative Currency Strengths: Calculated using the Rate of Change (ROC) over a user-defined lookback period (default: 14 bars), normalized to reflect performance versus USD. Positive values indicate strengthening, while negative values denote weakening.
Annualized Volatilities: Derived from the standard deviation of logarithmic returns, annualized assuming 252 trading days, and expressed as percentages to compare risk levels across pairs.
Full Pairwise Correlations: A comprehensive matrix displaying Pearson correlation coefficients between all pairs over the lookback period, aiding in identifying hedging opportunities (e.g., low or negative correlations for diversification).
Automated Pair Suggestions: Identifies the strongest and weakest currencies, proposing a long position in the pair to buy the strong currency and a short position (or opposite direction) to sell the weak currency against USD. Suggestions include estimated lot sizes based on user-input account balance, risk percentage (default: 1%), and a stop-loss proxy using 1x Average True Range (ATR).
Visual Elements: A table displays all metrics with color-coded rows for readability (optimized for dark mode), alternating backgrounds, and merged cells for suggestions. Strengths are also plotted in a separate pane with matching colors for trend visualization.
Customization: Users can adjust the lookback length, ATR period, account balance, and risk percentage via indicator settings to tailor the analysis.
Ensure access to IC Markets data in your TradingView account. The table appears in the top-left position by default and updates on the last bar. This tool is intended for educational and analytical purposes, supporting informed decision-making in forex trading by highlighting relative strengths, risks, and potential hedges.
Guidance on Choosing a Timeframe:
The indicator adapts to the chart's timeframe, with the lookback period influencing the historical window for metrics. Select based on your strategy:
Short-Term (Intraday/Scalping): Use 15-minute to 1-hour charts for timely signals; adjust lookback to 5–10 for responsiveness.
Medium-Term (Swing Trading): Opt for 4-hour to daily charts (recommended default) for balanced trends; 14-bar lookback covers days to weeks.
Long-Term (Position Trading): Choose weekly or monthly charts for macro views; increase lookback to 20–50 for smoother data.
Test across timeframes via backtesting to align with your risk and objectives.
Disclaimer:
This script is provided for informational and educational purposes only and does not constitute financial, investment, or trading advice. Trading forex involves significant risk of loss and is not suitable for all individuals. Past performance is not indicative of future results. The calculations, suggestions, and metrics (including lot sizes) are based on historical data and simplified assumptions, such as using ATR for stop-loss estimation, and may not account for real-time market conditions, slippage, commissions, or other factors. Users should conduct their own research, consult with qualified financial professionals, and verify the script's outputs before making any trading decisions. The author assumes no responsibility or liability for any losses incurred from the use of this script.
Nota Keluaran
This Pine Script (version 5) indicator, titled "Forex Pairs Relative Analysis and Suggestions," is designed for use on TradingView charts. It provides real-time analysis of major forex pairs sourced from the IC Markets exchange, facilitating relative value or pair trading strategies by evaluating currency strengths against the US Dollar (USD). The script focuses on seven major currencies—EUR, GBP, AUD, NZD, JPY, CAD, and CHF—through their respective pairs: EURUSD, GBPUSD, AUDUSD, NZDUSD, USDJPY, USDCAD, and USDCHF.Key features include:
Relative Currency Strengths: Calculated using the Rate of Change (ROC) over a user-defined lookback period (default: 14 bars), normalized to reflect performance versus USD. Positive values indicate strengthening, while negative values denote weakening.
Annualized Volatilities: Derived from the standard deviation of logarithmic returns, annualized assuming 252 trading days, and expressed as percentages to compare risk levels across pairs.
Full Pairwise Correlations: A comprehensive matrix displaying Pearson correlation coefficients between all pairs over the lookback period, aiding in identifying hedging opportunities (e.g., low or negative correlations for diversification).
Automated Pair Suggestions: Identifies the strongest and weakest currencies, proposing a long position in the pair to buy the strong currency and a short position (or opposite direction) to sell the weak currency against USD. Suggestions include estimated lot sizes based on user-input account balance, risk percentage (default: 1%), and a stop-loss proxy using 1x Average True Range (ATR).
Visual Elements: A table displays all metrics with color-coded rows for readability (optimized for dark mode), alternating backgrounds, and merged cells for suggestions. Strengths are also plotted in a separate pane with matching colors for trend visualization.
Customization: Users can adjust the lookback length, ATR period, account balance, and risk percentage via indicator settings to tailor the analysis.
Ensure access to IC Markets data in your TradingView account. The table appears in the top-left position by default and updates on the last bar. This tool is intended for educational and analytical purposes, supporting informed decision-making in forex trading by highlighting relative strengths, risks, and potential hedges.
Guidance on Choosing a Timeframe:
The indicator adapts to the chart's timeframe, with the lookback period influencing the historical window for metrics. Select based on your strategy:
Short-Term (Intraday/Scalping): Use 15-minute to 1-hour charts for timely signals; adjust lookback to 5–10 for responsiveness.
Medium-Term (Swing Trading): Opt for 4-hour to daily charts (recommended default) for balanced trends; 14-bar lookback covers days to weeks.
Long-Term (Position Trading): Choose weekly or monthly charts for macro views; increase lookback to 20–50 for smoother data.
Test across timeframes via backtesting to align with your risk and objectives.
Disclaimer:
This script is provided for informational and educational purposes only and does not constitute financial, investment, or trading advice. Trading forex involves significant risk of loss and is not suitable for all individuals. Past performance is not indicative of future results. The calculations, suggestions, and metrics (including lot sizes) are based on historical data and simplified assumptions, such as using ATR for stop-loss estimation, and may not account for real-time market conditions, slippage, commissions, or other factors. Users should conduct their own research, consult with qualified financial professionals, and verify the script's outputs before making any trading decisions. The author assumes no responsibility or liability for any losses incurred from the use of this script.
Nota Keluaran
This Pine Script (version 5) indicator, titled "Forex Pairs Relative Analysis and Suggestions," is designed for use on TradingView charts. It provides real-time analysis of major forex pairs sourced from the IC Markets exchange, facilitating relative value or pair trading strategies by evaluating currency strengths against the US Dollar (USD). The script focuses on seven major currencies—EUR, GBP, AUD, NZD, JPY, CAD, and CHF—through their respective pairs: EURUSD, GBPUSD, AUDUSD, NZDUSD, USDJPY, USDCAD, and USDCHF.Key Features:
Relative Currency Strengths: Calculated using the Rate of Change (ROC) over a user-defined lookback period (default: 14 bars), normalized to reflect performance versus USD. Positive values indicate strengthening, while negative values denote weakening.
Annualized Volatilities: Derived from the standard deviation of logarithmic returns, annualized assuming 252 trading days, and expressed as percentages to compare risk levels across pairs.
Full Pairwise Correlations: A comprehensive matrix displaying Pearson correlation coefficients between all pairs over the lookback period, aiding in identifying hedging opportunities (e.g., low or negative correlations for diversification).
Automated Pair Suggestions: Identifies the strongest and weakest currencies, proposing a long position in the pair to buy the strong currency and a short position (or opposite direction) to sell the weak currency against USD. Suggestions include estimated lot sizes based on user-input account balance, risk percentage (default: 1%), and a stop-loss proxy using 1x Average True Range (ATR).
Visual Elements: A table displays all metrics with color-coded rows for readability (optimized for dark mode), alternating backgrounds, and merged cells for suggestions. Strengths are also plotted in a separate pane with matching colors for trend visualization.
Customization: Users can adjust the lookback length, ATR period, account balance, and risk percentage via indicator settings to tailor the analysis.
Ensure access to IC Markets data in your TradingView account. The table appears in the top-left position by default and updates on the last bar. This tool is intended for educational and analytical purposes, supporting informed decision-making in forex trading by highlighting relative strengths, risks, and potential hedges.
Guidance on Choosing a Timeframe:
The indicator adapts to the chart's timeframe, with the lookback period influencing the historical window for metrics. Select based on your strategy:
Short-Term (Intraday/Scalping): Use 15-minute to 1-hour charts for timely signals; adjust lookback to 5–10 for responsiveness.
Medium-Term (Swing Trading): Opt for 4-hour to daily charts (recommended default) for balanced trends; 14-bar lookback covers days to weeks.
Long-Term (Position Trading): Choose weekly or monthly charts for macro views; increase lookback to 20–50 for smoother data.
Test across timeframes via backtesting to align with your risk and objectives.
Disclaimer
This script is provided for informational and educational purposes only and does not constitute financial, investment, or trading advice. Trading forex involves significant risk of loss and is not suitable for all individuals. Past performance is not indicative of future results. The calculations, suggestions, and metrics (including lot sizes) are based on historical data and simplified assumptions, such as using ATR for stop-loss estimation, and may not account for real-time market conditions, slippage, commissions, or other factors. Users should conduct their own research, consult with qualified financial professionals, and verify the script's outputs before making any trading decisions. The author assumes no responsibility or liability for any losses incurred from the use of this script.
Skrip dilindungi
Skrip ini diterbitkan sebagai sumber tertutup. Akan tetapi, anda boleh menggunakannya secara bebas dan tanpa apa-apa had – ketahui lebih di sini.
Penafian
Maklumat dan penerbitan adalah tidak bertujuan, dan tidak membentuk, nasihat atau cadangan kewangan, pelaburan, dagangan atau jenis lain yang diberikan atau disahkan oleh TradingView. Baca lebih dalam Terma Penggunaan.