OPEN-SOURCE SCRIPT
Volume-Weighted Price Levels (VWPL)

Introduction:
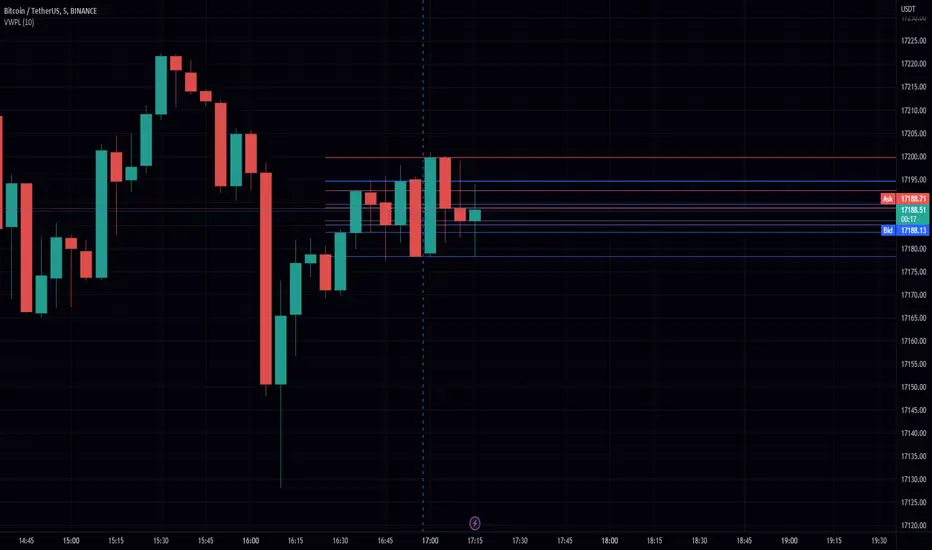
In this script, we will be creating an indicator that plots horizontal lines on the chart for each unique price in a given range, and colors them based on the volume of that price.
Explanation:
First, we define the input "Length" as an integer. This will determine the number of bars back from the current bar to include in the range.
We then create two arrays: "price" and "vol." The "price" array will store all the unique prices in the given range, and the "vol" array will store the corresponding volumes for those prices.
Using a for loop, we iterate through the range of bars and check if the current close price is already included in the "price" array. If it is not, we add it to the array and also add the corresponding volume to the "vol" array. If it is already included, we find the index of that price in the "price" array and add the current volume to the volume stored at that index in the "vol" array.
After the for loop, we find the maximum volume in the "vol" array and use that to find the corresponding price in the "price" array. This will be the price at which we draw the horizontal line.
We then create an array of lines called "lines" and, using another for loop, we iterate through the "price" array and add a line to the "lines" array for each price. The color of each line is determined by the volume of that price, using a color gradient from blue (lowest volume) to red (highest volume).
Finally, we use an if statement to check if the current bar is the last bar in the chart, and if it is, we use another for loop to iterate through the "lines" array and delete all the lines. This is to prevent the lines from being carried over to the next bar and potentially being plotted multiple times.
Conclusion:
This script can be useful for visualizing the price levels with the highest volume in a given range, as well as seeing how volume is distributed among different price levels. It can be helpful for identifying areas of significant buying or selling pressure.
Skrip sumber terbuka
Dalam semangat TradingView sebenar, pencipta skrip ini telah menjadikannya sumber terbuka, jadi pedagang boleh menilai dan mengesahkan kefungsiannya. Terima kasih kepada penulis! Walaupuan anda boleh menggunakan secara percuma, ingat bahawa penerbitan semula kod ini tertakluk kepada Peraturan Dalaman.
Penafian
Maklumat dan penerbitan adalah tidak bertujuan, dan tidak membentuk, nasihat atau cadangan kewangan, pelaburan, dagangan atau jenis lain yang diberikan atau disahkan oleh TradingView. Baca lebih dalam Terma Penggunaan.