PROTECTED SOURCE SCRIPT
EGX Monitor Dashboard By Biscuits_Trading_Solutions
لوحة مراقبة البورصة المصرية من Biscuits_Trading_Solutions
نظرة عامة:
لوحة مراقبة البورصة المصرية هي أداة تحليل فني شاملة مصممة لتوفير نظرة فورية وواضحة على صحة السوق. تجمع الأداة مؤشرات رئيسية مختارة بعناية لتناسب السوق المصري لتوفر عليك عبء إضافة عدد كبير من المؤشرات في وقت واحد على الشاشة - بما في ذلك متوسطات متحركة، MACD، RSI، ADX، ATR، وتحليل متقدم لحجم التداول (دلتا) - في جدول واحد وسهل القراءة على الرسم البياني. مثالية للمتداولين الذين يحتاجون لتقييم الاتجاه، الزخم، وديناميكيات الحجم في لمحة دون تشويش الشاشة.
English Version is below ⬇️⬇️

المميزات الرئيسية:
* لوحة متابعة للمتوسطات المتحركة: تتابع وتلون وضع السعر بالنسبة لـ 6 متوسطات متحركة رئيسية (200 بسيط، 100 بسيط/آسي، 50 بسيط، 20 آسي، 9 آسي).
* تحليل متقدم لـ MACD: تعرض قيمة هِستوجرام MACD، حالة التقاطع بين MACD وخط الإشارة، وتكشف عن انحرافات صعودية محتملة (Bullish Divergence).
* مقاييس الزخم: تتضمن قراءات RSI و ADX، مع تلوينها للإشارة إلى مناطق الشراء المفرط والبيع المفرط وقوة الاتجاه.
تحليل متطور للحجم:
*دلتا الحجم/السيولة (الفارق بين حجم الشراء وحجم البيع).
* الحجم مقارنة بمتوسطه المتحرك لـ 20 و 50 فترة (لمقارنته بفترة متوسطة 20 شمعة وطويلة 50 شمعة)
* دلتا الحجم مقارنة بمتوسطها المتحرك لـ 20 و 50 فترة لقياس ضغط البيع والشراء.
عرض مرئي نظيف: جميع البيانات معروضة في جدول شبه شفاف يمكن وضعه في أي مكان على الرسم البياني. يتم أيضًا رسم المتوسطات المتحركة بخفة للاستدلال البصري.
مدخلات قابلة للتخصيص: جميع أطوال المؤشرات، المضاعفات، وموضع الجدول قابلة للتعديل كليًا من الإعدادات.
إزاحة الشمعة: تسمح لك بمشاهدة قراءات المؤشر من عدد محدد من الشمعات السابقة، مما يفيد في تحليل الظروف السابقة.
طريقة الاستخدام:
* تقييم الاتجاه: انظر إلى جدول المتوسطات المتحركة. وجود عدة خلايا خضراء (السعر فوق المتوسط) يشير إلى اتجاه صاعد قوي، بينما يشير اللون الأحمر إلى اتجاه هابط.
* تأكيد الزخم: تحقق من مؤشر RSI (شراء مفرط >70، بيع مفرط <30) و ADX (اتجاه قوي >25) لفهم سياق الزخم.
*تأكيد الحجم: استخدم أعمدة الحجم لتأكيد الحركات. حركة السعر المصحوبة بحجم "أعلى من المتوسط" ودلتا "صعودي" تكون أكثر أهمية.
إشارات الدخول/الخروج:
* انحراف MACD الصعودي يمكن أن يشير إلى انعكاس محتمل.
* وجود "نعم" لـ "MACD > Sig" يؤكد الزخم الصعودي.
* قيم ATR المرتفعة تشير إلى زيادة التقلب، وغالبًا ما ترافق الاتجاهات القوية أو اختراقات المستويات.
الإعدادات:
ما عليك سوى إضافة المؤشر إلى الرسم البياني الخاص بك. ستظهر اللوحة تلقائيًا. يمكنك ضبط جميع المعاملات (أطوال المتوسطات المتحركة، إعدادات الحجم، مكان الجدول) في تبويب "الإدخالات" في نافذة المؤشر لتناسب أسلوب تداولك.
إخلاء مسؤولية: جميع الإشارات التي تظهر ليست دعوة للبيع والشراء، هذا المحتوى تعليمي يساعدك على قراءة الشاشة بشكل أفضل، وقرارك الاستثماري يعود لك وحدك.
---
EGX Monitor Dashboard By Biscuits_Trading_Solutions
Overview:
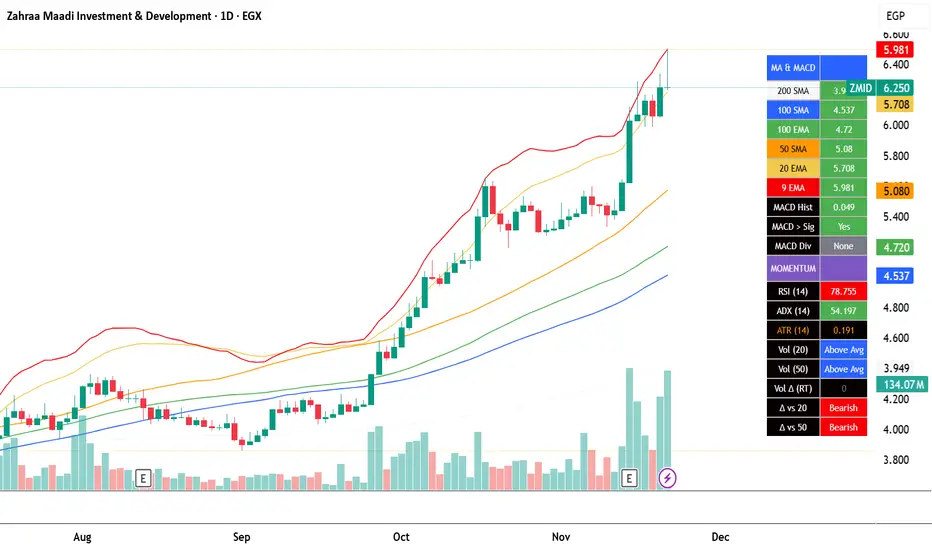
The EGX Monitor Dashboard is a comprehensive technical analysis tool designed to provide a clear and immediate overview of the market's health. It consolidates key indicators, carefully selected for the Egyptian market, saving you the burden of adding a large number of indicators to your screen at once—including moving averages, MACD, RSI, ADX, ATR, and advanced volume delta analysis—into a single, easy-to-read table on your chart. Perfect for traders who need to assess trend, momentum, and volume dynamics at a glance without cluttering their screen.
Key Features:
* Moving Average Dashboard: Tracks and color-codes the price position relative to 6 key moving averages (200 SMA, 100 SMA/EMA, 50 SMA, 20 EMA, 9 EMA).
* Advanced MACD Analysis: Displays the MACD histogram value, the MACD vs. Signal line crossover state, and detects potential bullish divergences.
* Momentum Gauges: Includes RSI and ADX readings, color-coded for overbought/oversold and trend strength conditions.
Advanced Volume/Liquidity Analysis:
* Volume Delta (the difference between buying and selling volume).
* Volume compared to its 20 and 50-period moving averages (for medium-term 20-bar and long-term 50-bar comparisons).
* Volume Delta compared to its 20 and 50-period moving averages to measure buying/selling pressure.
Clean Visualization: All data is presented in a semi-transparent table that can be positioned anywhere on the chart. The moving averages are also plotted lightly for visual reference.
Customizable Inputs: All indicator lengths, multipliers, and the table position are fully adjustable in the settings.
Bar Offset: Allows you to view the indicator readings from a specific number of bars back, useful for analyzing past conditions.
How to Use:
* Trend Assessment: Look at the MA table. A cluster of green "Bullish" cells (price above MA) indicates a strong uptrend, while red indicates a downtrend.
* Momentum Confirmation: Check the RSI (overbought >70, oversold <30) and ADX (strong trend >25) for momentum context.
* Volume Confirmation: Use the volume columns to confirm moves. A price move with "Above Avg" volume and "Bullish" Delta is more significant.
Entry/Exit Clues:
* A "Bullish" MACD divergence can signal a potential reversal.
* A "Yes" for "MACD > Sig" confirms bullish momentum.
* High ATR values indicate increased volatility, often accompanying strong trends or breakouts.
Configuration:
Simply add the indicator to your chart. The dashboard will appear automatically. You can adjust all parameters (MA lengths, volume settings, table position) in the indicator's "Inputs" tab to suit your trading style.
Disclaimer: All signals that appear are not an invitation to buy or sell. This content is educational and is intended to help you read the screen better. Your investment decision is yours alone.
نظرة عامة:
لوحة مراقبة البورصة المصرية هي أداة تحليل فني شاملة مصممة لتوفير نظرة فورية وواضحة على صحة السوق. تجمع الأداة مؤشرات رئيسية مختارة بعناية لتناسب السوق المصري لتوفر عليك عبء إضافة عدد كبير من المؤشرات في وقت واحد على الشاشة - بما في ذلك متوسطات متحركة، MACD، RSI، ADX، ATR، وتحليل متقدم لحجم التداول (دلتا) - في جدول واحد وسهل القراءة على الرسم البياني. مثالية للمتداولين الذين يحتاجون لتقييم الاتجاه، الزخم، وديناميكيات الحجم في لمحة دون تشويش الشاشة.
English Version is below ⬇️⬇️
المميزات الرئيسية:
* لوحة متابعة للمتوسطات المتحركة: تتابع وتلون وضع السعر بالنسبة لـ 6 متوسطات متحركة رئيسية (200 بسيط، 100 بسيط/آسي، 50 بسيط، 20 آسي، 9 آسي).
* تحليل متقدم لـ MACD: تعرض قيمة هِستوجرام MACD، حالة التقاطع بين MACD وخط الإشارة، وتكشف عن انحرافات صعودية محتملة (Bullish Divergence).
* مقاييس الزخم: تتضمن قراءات RSI و ADX، مع تلوينها للإشارة إلى مناطق الشراء المفرط والبيع المفرط وقوة الاتجاه.
تحليل متطور للحجم:
*دلتا الحجم/السيولة (الفارق بين حجم الشراء وحجم البيع).
* الحجم مقارنة بمتوسطه المتحرك لـ 20 و 50 فترة (لمقارنته بفترة متوسطة 20 شمعة وطويلة 50 شمعة)
* دلتا الحجم مقارنة بمتوسطها المتحرك لـ 20 و 50 فترة لقياس ضغط البيع والشراء.
عرض مرئي نظيف: جميع البيانات معروضة في جدول شبه شفاف يمكن وضعه في أي مكان على الرسم البياني. يتم أيضًا رسم المتوسطات المتحركة بخفة للاستدلال البصري.
مدخلات قابلة للتخصيص: جميع أطوال المؤشرات، المضاعفات، وموضع الجدول قابلة للتعديل كليًا من الإعدادات.
إزاحة الشمعة: تسمح لك بمشاهدة قراءات المؤشر من عدد محدد من الشمعات السابقة، مما يفيد في تحليل الظروف السابقة.
طريقة الاستخدام:
* تقييم الاتجاه: انظر إلى جدول المتوسطات المتحركة. وجود عدة خلايا خضراء (السعر فوق المتوسط) يشير إلى اتجاه صاعد قوي، بينما يشير اللون الأحمر إلى اتجاه هابط.
* تأكيد الزخم: تحقق من مؤشر RSI (شراء مفرط >70، بيع مفرط <30) و ADX (اتجاه قوي >25) لفهم سياق الزخم.
*تأكيد الحجم: استخدم أعمدة الحجم لتأكيد الحركات. حركة السعر المصحوبة بحجم "أعلى من المتوسط" ودلتا "صعودي" تكون أكثر أهمية.
إشارات الدخول/الخروج:
* انحراف MACD الصعودي يمكن أن يشير إلى انعكاس محتمل.
* وجود "نعم" لـ "MACD > Sig" يؤكد الزخم الصعودي.
* قيم ATR المرتفعة تشير إلى زيادة التقلب، وغالبًا ما ترافق الاتجاهات القوية أو اختراقات المستويات.
الإعدادات:
ما عليك سوى إضافة المؤشر إلى الرسم البياني الخاص بك. ستظهر اللوحة تلقائيًا. يمكنك ضبط جميع المعاملات (أطوال المتوسطات المتحركة، إعدادات الحجم، مكان الجدول) في تبويب "الإدخالات" في نافذة المؤشر لتناسب أسلوب تداولك.
إخلاء مسؤولية: جميع الإشارات التي تظهر ليست دعوة للبيع والشراء، هذا المحتوى تعليمي يساعدك على قراءة الشاشة بشكل أفضل، وقرارك الاستثماري يعود لك وحدك.
---
EGX Monitor Dashboard By Biscuits_Trading_Solutions
Overview:
The EGX Monitor Dashboard is a comprehensive technical analysis tool designed to provide a clear and immediate overview of the market's health. It consolidates key indicators, carefully selected for the Egyptian market, saving you the burden of adding a large number of indicators to your screen at once—including moving averages, MACD, RSI, ADX, ATR, and advanced volume delta analysis—into a single, easy-to-read table on your chart. Perfect for traders who need to assess trend, momentum, and volume dynamics at a glance without cluttering their screen.
Key Features:
* Moving Average Dashboard: Tracks and color-codes the price position relative to 6 key moving averages (200 SMA, 100 SMA/EMA, 50 SMA, 20 EMA, 9 EMA).
* Advanced MACD Analysis: Displays the MACD histogram value, the MACD vs. Signal line crossover state, and detects potential bullish divergences.
* Momentum Gauges: Includes RSI and ADX readings, color-coded for overbought/oversold and trend strength conditions.
Advanced Volume/Liquidity Analysis:
* Volume Delta (the difference between buying and selling volume).
* Volume compared to its 20 and 50-period moving averages (for medium-term 20-bar and long-term 50-bar comparisons).
* Volume Delta compared to its 20 and 50-period moving averages to measure buying/selling pressure.
Clean Visualization: All data is presented in a semi-transparent table that can be positioned anywhere on the chart. The moving averages are also plotted lightly for visual reference.
Customizable Inputs: All indicator lengths, multipliers, and the table position are fully adjustable in the settings.
Bar Offset: Allows you to view the indicator readings from a specific number of bars back, useful for analyzing past conditions.
How to Use:
* Trend Assessment: Look at the MA table. A cluster of green "Bullish" cells (price above MA) indicates a strong uptrend, while red indicates a downtrend.
* Momentum Confirmation: Check the RSI (overbought >70, oversold <30) and ADX (strong trend >25) for momentum context.
* Volume Confirmation: Use the volume columns to confirm moves. A price move with "Above Avg" volume and "Bullish" Delta is more significant.
Entry/Exit Clues:
* A "Bullish" MACD divergence can signal a potential reversal.
* A "Yes" for "MACD > Sig" confirms bullish momentum.
* High ATR values indicate increased volatility, often accompanying strong trends or breakouts.
Configuration:
Simply add the indicator to your chart. The dashboard will appear automatically. You can adjust all parameters (MA lengths, volume settings, table position) in the indicator's "Inputs" tab to suit your trading style.
Disclaimer: All signals that appear are not an invitation to buy or sell. This content is educational and is intended to help you read the screen better. Your investment decision is yours alone.
Skrip dilindungi
Skrip ini diterbitkan sebagai sumber tertutup. Akan tetapi, anda boleh menggunakannya secara bebas dan tanpa apa-apa had – ketahui lebih di sini.
Penafian
Maklumat dan penerbitan adalah tidak bertujuan, dan tidak membentuk, nasihat atau cadangan kewangan, pelaburan, dagangan atau jenis lain yang diberikan atau disahkan oleh TradingView. Baca lebih dalam Terma Penggunaan.