OPEN-SOURCE SCRIPT
Telah dikemas kini [blackcat] L2 John Ehlers Undersampled Double MA
Level2
Background
This is a novel "undersampling data" processing trick proposed by John F. Ehlers in his April 2023 article "Just Ignore Them".
Function
In signal processing, undersampling, or bandpass sampling, is a technique whereby a bandpass-filtered signal is sampled at a sample rate below its Nyquist rate (twice the upper cut-off frequency), but the signal can still be reconstructed. When undersampling a bandpass signal, the samples are indistinguishable from samples of a low-frequency alias of the high-frequency signal.
John Ehlers notes that data smoothing is often used to avoid trading spikes. While this can result in fewer trading signals, it can also result in a delay in those trading signals. He describes how undersampling can be used in conjunction with Hann window finite impulse response (FIR) filters to remove high-frequency components in price data, resulting in less delay than traditional smoothing filters.
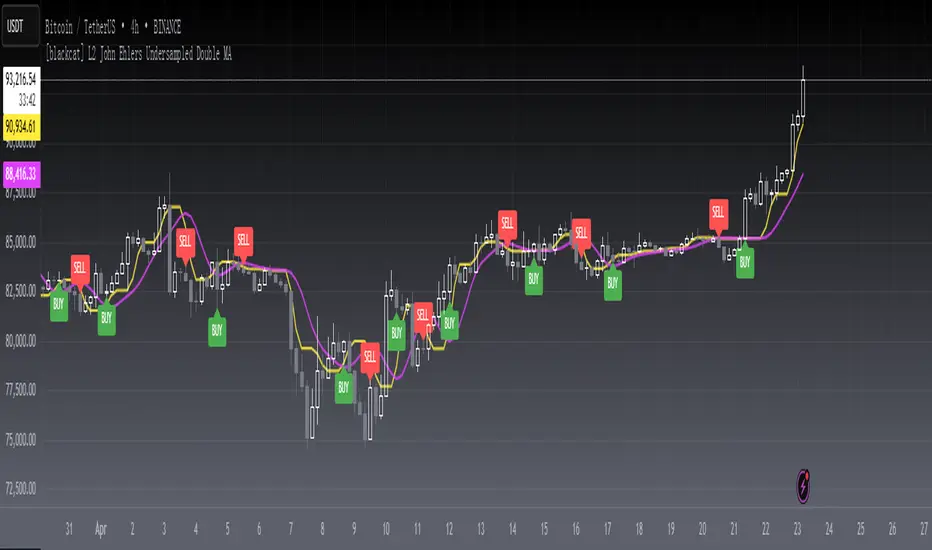
In this indicator, Hann windowing is applied a a pair of fast/slow moving averages which is used to improve their response perfomrnace. Yellow line is the fast line while fuchsia line is the slow line. You can judge bull bear stattus by checking the status it is in golden cross or in dead cross status.
Remarks
Feedbacks are appreciated.
Background
This is a novel "undersampling data" processing trick proposed by John F. Ehlers in his April 2023 article "Just Ignore Them".
Function
In signal processing, undersampling, or bandpass sampling, is a technique whereby a bandpass-filtered signal is sampled at a sample rate below its Nyquist rate (twice the upper cut-off frequency), but the signal can still be reconstructed. When undersampling a bandpass signal, the samples are indistinguishable from samples of a low-frequency alias of the high-frequency signal.
John Ehlers notes that data smoothing is often used to avoid trading spikes. While this can result in fewer trading signals, it can also result in a delay in those trading signals. He describes how undersampling can be used in conjunction with Hann window finite impulse response (FIR) filters to remove high-frequency components in price data, resulting in less delay than traditional smoothing filters.
In this indicator, Hann windowing is applied a a pair of fast/slow moving averages which is used to improve their response perfomrnace. Yellow line is the fast line while fuchsia line is the slow line. You can judge bull bear stattus by checking the status it is in golden cross or in dead cross status.
Remarks
Feedbacks are appreciated.
Nota Keluaran
OVERVIEWThe [blackcat] L2 John Ehlers Undersampled Double MA indicator applies advanced filtering techniques to create smooth moving averages, helping traders identify trends and potential entry/exit points. Developed by renowned trader John F. Ehlers, this indicator uses undersampling and Hanning filters to reduce noise and enhance the clarity of moving averages. It provides clear buy and sell signals through labeled crossovers, making it a valuable tool for technical analysis 📈💹.
FEATURES
Utilizes Hanning Finite Impulse Response (FIR) Filters for smoothing data:
Applies a custom function to calculate filtered values using the Hanning window method.
Includes adjustable Fast Length and Slow Length inputs for customization:
Fast Length: Default set to 3.
Slow Length: Default set to 8.
Plots two moving averages on the chart:
Fast Average: Yellow line representing short-term trends.
Slow Average: Fuchsia line representing long-term trends.
Displays buy ('BUY') and sell ('SELL') labels on the chart for quick identification 🏷️
Generates alerts when fast and slow averages cross over or under each other 🔔
HOW TO USE
Add the indicator to your TradingView chart by selecting it from the indicators list.
Adjust the Fast Length and Slow Length parameters to suit your preferred sensitivity ⚙️.
Monitor the chart for buy and sell labels indicating potential trade opportunities.
Set up alerts based on the generated signals to receive notifications when conditions are met 📲.
Use the moving averages as dynamic support/resistance levels for additional context.
LIMITATIONS
The indicator may lag behind price movements due to its smoothing nature.
False signals can occur in highly volatile or ranging markets 🌪️.
Users should always confirm signals with other forms of analysis before making trading decisions.
NOTES
Ensure that you have sufficient historical data available for accurate calculations.
Test the indicator thoroughly on demo accounts before applying it to live trading 🔍.
Customize the appearance and parameters as needed to fit your trading strategy.
Skrip sumber terbuka
Dalam semangat TradingView sebenar, pencipta skrip ini telah menjadikannya sumber terbuka, jadi pedagang boleh menilai dan mengesahkan kefungsiannya. Terima kasih kepada penulis! Walaupuan anda boleh menggunakan secara percuma, ingat bahawa penerbitan semula kod ini tertakluk kepada Peraturan Dalaman.
Avoid losing contact!Don't miss out! The first and most important thing to do is to join my Discord chat now! Click here to start your adventure: discord.com/invite/ZTGpQJq 防止失联,请立即行动,加入本猫聊天群: discord.com/invite/ZTGpQJq
Penafian
Maklumat dan penerbitan adalah tidak bertujuan, dan tidak membentuk, nasihat atau cadangan kewangan, pelaburan, dagangan atau jenis lain yang diberikan atau disahkan oleh TradingView. Baca lebih dalam Terma Penggunaan.