OPEN-SOURCE SCRIPT
Telah dikemas kini Hayden's Advanced Relative Strength Index (RSI)
Preface: I'm just the bartender serving today's freshly blended concoction; I'd like to send a massive THANK YOU to iFuSiiOnzZ, Koalafied_3, LonesomeTheBlue, LazyBear, dgtrd and the rest of the PineWizards for the locally-sourced ingredients. I am simply a code editor, not a code author. The book that inspired this indicator is a free download, plus all of the pieces I used were free code from the PineWizards; my hope is that any additional useful development of The Complete RSI trading system also is offered open-source to the community for collaboration.
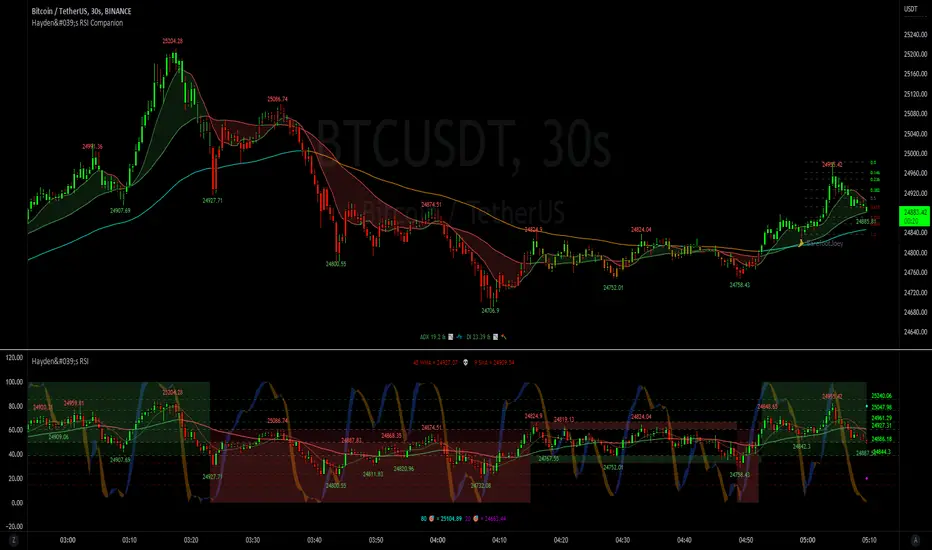
Features: Fixed & Custom price targeting. Triple trend state detection. Advanced data ticker. Candles, bars, or line RSI . Stochastic of over 20 indicators for adjustable entry/exit signals. Customizable trader watermark. Trend lines for spotting wedges , triangles, pennants , etc. Divergences for spotting potential reversals and Momentum Discrepancy Reversal Point opportunities. RSI percent change and price pivot labels. Gradient bar coloring on-chart.
‼ IMPORTANT: Hover over labels for additional information. Google & read John Hayden's "The Complete RSI" pdf book for comprehensive instructions before attempting to trade with this indicator. Always keep an eye on higher/stronger timeframes.
⚠ DISCLAIMER: DYOR. Not financial advice. Not a trading system. I am not affiliated with TradingView or John Hayden; this is my own personally PineScripted presentation of a suitable RSI to use when trading according to Hayden's rules.
About the Editor: I am a former-FINRA Registered Representative, inventor/patent-holder, and self-taught PineScripter. I mostly code on a v3 Pinescript level so expect heavy scripts that could use some shortening with modern conventions.
Hayden's RSI Rules:
📈 An Uptrend is indicated when:
1. RSI is in the 80 to 40 range
2. The chart shows simple bearish divergence
3. The chart shows Hidden bullish divergence
4. The chart shows Momentum Discrepancy Reversal Up
5. Upside targets being hit
6. 9-bar simple MA is greater than the 45-bar EMA on RSI
7. Counter-trend declines do not exceed 50% of the previous rally
🔮 An Uptrend is in danger when:
1. Longer timeframe fading rally
2. a) Multiple long-term bearish divergences. b) Upside targets not being hit.
3. 9-bar simple MA is less than the 45-bar EMA on RSI
4. Hidden bearish divergence, or simple bullish divergence
5. Deep counter-trend retracements greater than 50%
📉 A Downtrend is indicated when:
1. RSI is in the 60 to 20 range
2. The chart shows simple bullish divergences.
3. The chart shows Hidden bearish divergence
4. The chart shows Momentum Discrepancy Reversal Down
5. Downside targets being hit
6. 9-bar simple MA is less than the 45-bar EMA on RSI
7. Counter-trend rallies do not exceed 50% of the previous decline
🔮 A Downtrend is in danger when:
1. Longer timeframe fading decline
2. a) Multiple long-term bullish divergences. b) Downside targets not being hit.
3. 9-bar simple MA is greater than the 45-bar EMA on RSI
4. Hidden bullish divergence , or simple bearish divergence
5. Steep counter-trend retracements greater than 50%
Nota Keluaran
Update: Wishlist. RSI Candle Border. Watermark. Code Condense. Nota Keluaran
Update: Proper code author citations/credits. Ticker MA slope bug fix. Ticker no longer displays $ signs (useful for analysis of data that isnt price: weather, population, economic indicators, etc). To-do & WIsh Lists. Hayden defaults. Settings menu formatting. Some tooltips. Merged watermark to the ticker, with 2 user-selectable ticker displays. Moving forward, there will be a private Developer version for me to work on, and updates are to be rolled out publicly about 1x per month.Nota Keluaran
June Update: Tooltips from the book. Settings menu. Trend line data on hover labels. Pivot Targets on hover labels. Label size settings. Ticker display & ticker bug fixes..Nota Keluaran
July & August Updates: Settings Menu. Default Variables. ⚡MAJOR: 🛑Stop loss & 🎯target labels with Reward:Risk ratio calculations. Angle & Slope bug removal. User configurable chart bar color. ⚡MAJOR: Ticker overhaul to the most recent analysis modules. Stochastic[X]. Code Cleanup. In order to receive these updates, PLEASE remove this indicator from your charts, refresh your window/app, and reload it from the search/favorites.Nota Keluaran
Fixed: Candle borders appearing during line or bar settings, and some minor refactoring & bug fixes. Huge THANKS to trader PVIII for reporting the candle bug. Please remove and reload this indicator from your charts in order to receive the updates.Skrip sumber terbuka
Dalam semangat TradingView sebenar, pencipta skrip ini telah menjadikannya sumber terbuka, jadi pedagang boleh menilai dan mengesahkan kefungsiannya. Terima kasih kepada penulis! Walaupuan anda boleh menggunakan secara percuma, ingat bahawa penerbitan semula kod ini tertakluk kepada Peraturan Dalaman.
Made w/ ❤ by @BarefootJoey ✌💗📈
Penafian
Maklumat dan penerbitan adalah tidak bertujuan, dan tidak membentuk, nasihat atau cadangan kewangan, pelaburan, dagangan atau jenis lain yang diberikan atau disahkan oleh TradingView. Baca lebih dalam Terma Penggunaan.
Skrip sumber terbuka
Dalam semangat TradingView sebenar, pencipta skrip ini telah menjadikannya sumber terbuka, jadi pedagang boleh menilai dan mengesahkan kefungsiannya. Terima kasih kepada penulis! Walaupuan anda boleh menggunakan secara percuma, ingat bahawa penerbitan semula kod ini tertakluk kepada Peraturan Dalaman.
Made w/ ❤ by @BarefootJoey ✌💗📈
Penafian
Maklumat dan penerbitan adalah tidak bertujuan, dan tidak membentuk, nasihat atau cadangan kewangan, pelaburan, dagangan atau jenis lain yang diberikan atau disahkan oleh TradingView. Baca lebih dalam Terma Penggunaan.