OPEN-SOURCE SCRIPT
Telah dikemas kini MA Deviation with Volatility Thresholds
Price Deviation from MA with Dynamic Thresholds - TradingView Script Description
Overview
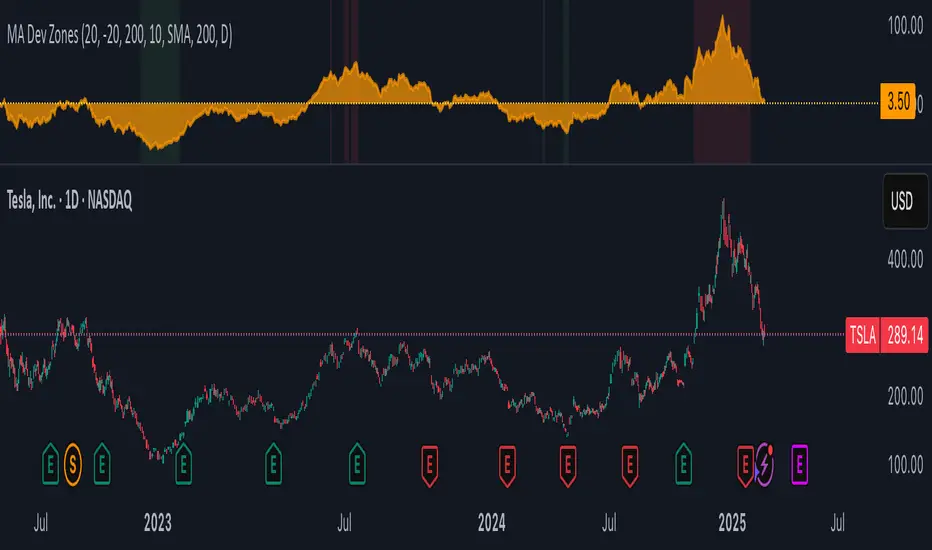
The Price Deviation from Moving Average (MA) with Dynamic Thresholds indicator is designed to measure and visualize how far the current price deviates from a chosen moving average (SMA or EMA) in percentage terms. It provides traders with valuable insights into whether the asset is significantly overbought or oversold relative to its historical mean.
One of the standout features of this indicator is its ability to dynamically adjust overbought and oversold thresholds based on historical volatility, making it more adaptable across different asset classes and market conditions.
Key Features
✅ Customizable Moving Average
Choose between Simple Moving Average (SMA) or Exponential Moving Average (EMA).
Adjustable MA period (default: 200).
Select the timeframe for the MA calculation (default: Daily).
✅ Percentage-Based Deviation Measurement
Measures how much the price has deviated from the selected moving average in percentage terms.
Helps to identify extreme price movements relative to historical trends.
✅ Static & Dynamic Overbought/Oversold Thresholds
Static Thresholds: Users can set fixed percentage levels for overbought and oversold conditions (default: ±20%).
Dynamic Thresholds (enabled by default): Automatically adjust based on historical volatility.
Uses standard deviation of price changes over a specified period (default: 200 candles).
Thresholds are calculated as volatility × a user-defined multiplier (default: 10).
✅ Visual Enhancements
Background Highlighting:
Red when the price exceeds the overbought threshold.
Green when the price drops below the oversold threshold.
Area Chart Representation: The deviation is plotted as a filled orange area (30% opacity) to enhance visual clarity.
Zero Line in Yellow: Helps in quickly identifying when the price is near the moving average.
How to Use
📌 Trend Confirmation & Mean Reversion Trading:
If the deviation is consistently positive, it indicates an uptrend, while negative values suggest a downtrend.
If the price significantly deviates from the MA and enters the overbought/oversold zone, a potential mean reversion opportunity may arise.
📌 Volatility-Adaptive Thresholds:
When enabled, dynamic thresholds help to adjust for different asset volatilities.
Suitable for traders dealing with assets that exhibit varying levels of price fluctuations.
📌 Combining with Other Indicators:
Works well with RSI, Bollinger Bands, and MACD to confirm trend strength or potential reversals.
Can be used in conjunction with support & resistance levels for added confirmation.
Customization Options
Moving Average Type: SMA or EMA.
Moving Average Period & Timeframe Selection.
Static Overbought/Oversold Levels.
Dynamic Thresholds:
Toggle ON/OFF.
Set the Lookback Period for volatility calculation.
Adjust the Volatility Multiplier for fine-tuning threshold sensitivity.
Why Use This Indicator?
🔹 Adaptive to Different Markets: Works with stocks, forex, crypto, commodities, and indices.
🔹 Useful for Both Trend-Following & Mean Reversion Strategies.
🔹 Volatility-Based Adjustments Ensure Market-Relevant Thresholds.
🔹 Enhances Market Awareness by Identifying Extreme Price Deviations.
Final Thoughts
The Price Deviation from MA with Dynamic Thresholds indicator is a powerful tool for traders who want to gauge price extremes and identify potential turning points in the market. With both static and dynamic threshold options, it can be tailored to different trading styles and asset behaviors.
💡 Tip: Experiment with different MA types, periods, and volatility multipliers to find settings that best suit your preferred trading strategy. 🚀
Overview
The Price Deviation from Moving Average (MA) with Dynamic Thresholds indicator is designed to measure and visualize how far the current price deviates from a chosen moving average (SMA or EMA) in percentage terms. It provides traders with valuable insights into whether the asset is significantly overbought or oversold relative to its historical mean.
One of the standout features of this indicator is its ability to dynamically adjust overbought and oversold thresholds based on historical volatility, making it more adaptable across different asset classes and market conditions.
Key Features
✅ Customizable Moving Average
Choose between Simple Moving Average (SMA) or Exponential Moving Average (EMA).
Adjustable MA period (default: 200).
Select the timeframe for the MA calculation (default: Daily).
✅ Percentage-Based Deviation Measurement
Measures how much the price has deviated from the selected moving average in percentage terms.
Helps to identify extreme price movements relative to historical trends.
✅ Static & Dynamic Overbought/Oversold Thresholds
Static Thresholds: Users can set fixed percentage levels for overbought and oversold conditions (default: ±20%).
Dynamic Thresholds (enabled by default): Automatically adjust based on historical volatility.
Uses standard deviation of price changes over a specified period (default: 200 candles).
Thresholds are calculated as volatility × a user-defined multiplier (default: 10).
✅ Visual Enhancements
Background Highlighting:
Red when the price exceeds the overbought threshold.
Green when the price drops below the oversold threshold.
Area Chart Representation: The deviation is plotted as a filled orange area (30% opacity) to enhance visual clarity.
Zero Line in Yellow: Helps in quickly identifying when the price is near the moving average.
How to Use
📌 Trend Confirmation & Mean Reversion Trading:
If the deviation is consistently positive, it indicates an uptrend, while negative values suggest a downtrend.
If the price significantly deviates from the MA and enters the overbought/oversold zone, a potential mean reversion opportunity may arise.
📌 Volatility-Adaptive Thresholds:
When enabled, dynamic thresholds help to adjust for different asset volatilities.
Suitable for traders dealing with assets that exhibit varying levels of price fluctuations.
📌 Combining with Other Indicators:
Works well with RSI, Bollinger Bands, and MACD to confirm trend strength or potential reversals.
Can be used in conjunction with support & resistance levels for added confirmation.
Customization Options
Moving Average Type: SMA or EMA.
Moving Average Period & Timeframe Selection.
Static Overbought/Oversold Levels.
Dynamic Thresholds:
Toggle ON/OFF.
Set the Lookback Period for volatility calculation.
Adjust the Volatility Multiplier for fine-tuning threshold sensitivity.
Why Use This Indicator?
🔹 Adaptive to Different Markets: Works with stocks, forex, crypto, commodities, and indices.
🔹 Useful for Both Trend-Following & Mean Reversion Strategies.
🔹 Volatility-Based Adjustments Ensure Market-Relevant Thresholds.
🔹 Enhances Market Awareness by Identifying Extreme Price Deviations.
Final Thoughts
The Price Deviation from MA with Dynamic Thresholds indicator is a powerful tool for traders who want to gauge price extremes and identify potential turning points in the market. With both static and dynamic threshold options, it can be tailored to different trading styles and asset behaviors.
💡 Tip: Experiment with different MA types, periods, and volatility multipliers to find settings that best suit your preferred trading strategy. 🚀
Nota Keluaran
Price Deviation from MA with Dynamic Thresholds - TradingView Script DescriptionOverview
The Price Deviation from Moving Average (MA) with Dynamic Thresholds indicator is designed to measure and visualize how far the current price deviates from a chosen moving average (SMA or EMA) in percentage terms. It provides traders with valuable insights into whether the asset is significantly overbought or oversold relative to its historical mean.
One of the standout features of this indicator is its ability to dynamically adjust overbought and oversold thresholds based on historical volatility, making it more adaptable across different asset classes and market conditions.
Key Features
✅ Customizable Moving Average
Choose between Simple Moving Average (SMA) or Exponential Moving Average (EMA).
Adjustable MA period (default: 200).
Select the timeframe for the MA calculation (default: Daily).
✅ Percentage-Based Deviation Measurement
Measures how much the price has deviated from the selected moving average in percentage terms.
Helps to identify extreme price movements relative to historical trends.
✅ Static & Dynamic Overbought/Oversold Thresholds
Static Thresholds: Users can set fixed percentage levels for overbought and oversold conditions (default: ±20%).
Dynamic Thresholds (enabled by default): Automatically adjust based on historical volatility.
Uses standard deviation of price changes over a specified period (default: 200 candles).
Thresholds are calculated as volatility × a user-defined multiplier (default: 10).
✅ Visual Enhancements
Background Highlighting:
Red when the price exceeds the overbought threshold.
Green when the price drops below the oversold threshold.
Area Chart Representation: The deviation is plotted as a filled orange area (30% opacity) to enhance visual clarity.
Zero Line in Yellow: Helps in quickly identifying when the price is near the moving average.
How to Use
📌 Trend Confirmation & Mean Reversion Trading:
If the deviation is consistently positive, it indicates an uptrend, while negative values suggest a downtrend.
If the price significantly deviates from the MA and enters the overbought/oversold zone, a potential mean reversion opportunity may arise.
📌 Volatility-Adaptive Thresholds:
When enabled, dynamic thresholds help to adjust for different asset volatilities.
Suitable for traders dealing with assets that exhibit varying levels of price fluctuations.
📌 Combining with Other Indicators:
Works well with RSI, Bollinger Bands, and MACD to confirm trend strength or potential reversals.
Can be used in conjunction with support & resistance levels for added confirmation.
Customization Options
Moving Average Type: SMA or EMA.
Moving Average Period & Timeframe Selection.
Static Overbought/Oversold Levels.
Dynamic Thresholds:
Toggle ON/OFF.
Set the Lookback Period for volatility calculation.
Adjust the Volatility Multiplier for fine-tuning threshold sensitivity.
Why Use This Indicator?
🔹 Adaptive to Different Markets: Works with stocks, forex, crypto, commodities, and indices.
🔹 Useful for Both Trend-Following & Mean Reversion Strategies.
🔹 Volatility-Based Adjustments Ensure Market-Relevant Thresholds.
🔹 Enhances Market Awareness by Identifying Extreme Price Deviations.
Final Thoughts
The Price Deviation from MA with Dynamic Thresholds indicator is a powerful tool for traders who want to gauge price extremes and identify potential turning points in the market. With both static and dynamic threshold options, it can be tailored to different trading styles and asset behaviors.
💡 Tip: Experiment with different MA types, periods, and volatility multipliers to find settings that best suit your preferred trading strategy. 🚀
Skrip sumber terbuka
Dalam semangat TradingView sebenar, pencipta skrip ini telah menjadikannya sumber terbuka, jadi pedagang boleh menilai dan mengesahkan kefungsiannya. Terima kasih kepada penulis! Walaupuan anda boleh menggunakan secara percuma, ingat bahawa penerbitan semula kod ini tertakluk kepada Peraturan Dalaman.
Penafian
Maklumat dan penerbitan adalah tidak bertujuan, dan tidak membentuk, nasihat atau cadangan kewangan, pelaburan, dagangan atau jenis lain yang diberikan atau disahkan oleh TradingView. Baca lebih dalam Terma Penggunaan.