OPEN-SOURCE SCRIPT
Adaptive Z-Momentum (AZM) [Blk0ut]
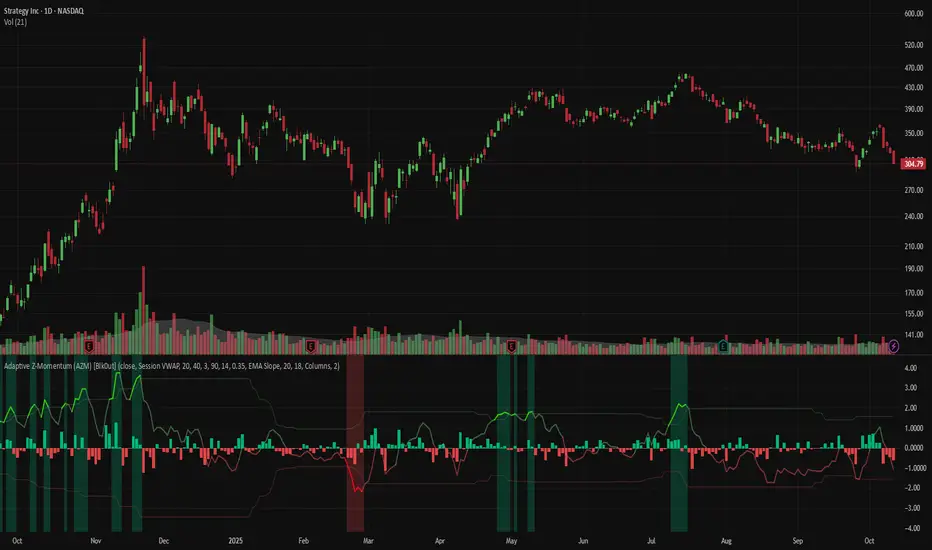
Adaptive Z-Momentum (AZM) is a momentum indicator that expresses the normalized deviation of price from a dynamic anchor (VWAP or EMA) in standard-score (z-score) terms, with adaptive “extreme” thresholds, trend sensitivity, and optional regime filtering. The line color, background shading, and labels help you visually discern when momentum is mild, building, or overextended.
---
## Features & Concept
* Computes **z = (price – anchor) / σ**, where the anchor is either Session VWAP (intraday) or EMA (non-intraday).
* Uses exponential moving averages (EWMA) to adaptively estimate the running mean and variance, making the indicator responsive to regime changes.
* Defines an **adaptive extreme threshold** (±z threshold) based on the chosen percentile of |z| over a lookback window (e.g. 90th percentile) — dynamically adjusting to volatility environment.
* Colors the main z-line **differently when inside vs. outside the extreme thresholds**, giving immediate visual feedback.
* Optionally shades the background when momentum is over the extremes (bullish or bearish).
* Supports a **self-tuning mode** (ADX-aware) that tightens or relaxes lookback/smoothing in strong trend vs. chop regimes.
* Regime filtering options (EMA slope or ADX threshold) let you filter signals in trend vs. non-trend markets.
* Plots Δz (the change in z) in various styles to help detect acceleration or deceleration in momentum.
* Adds optional thrust/fade labels to highlight when z crosses ±extreme zones, or when momentum stalls.
---
## How to Use
* Look for **z crossing** above zero (bullish momentum) or below zero (bearish momentum).
* When **z enters the extreme band**, it suggests strong momentum; when it exits, that may indicate exhaustion or reversal.
* Watch **Δz** (momentum acceleration) for clues of weakening or strengthening momentum before z itself reacts.
* Use the **regime filter** to enforce that signals only count in favorable directional markets.
* Customize inputs: lookback window, smoothing length, extreme percentile, ADX/auto settings, colors, etc., to match your trading style and timeframe.
*Use VWAP as the anchor on intraday/session charts — because it resets each session, it highlights deviations from session “fair value” and captures volume-flow bias.
*Use EMA on swing or multi-day charts — it doesn’t reset, so it preserves trend structure and gives a smoother momentum baseline across sessions.
*In trending markets, EMA tends to deliver more reliable momentum extremes; in range or mean-reversion regimes, VWAP often gives more intuitive reversal zones.
---
## Limitations & Disclaimers
* Like all indicators, AZM is **lagging** (though adaptive) and should not be used as a standalone entry/exit trigger — always combine with price action, structure, or confirmation.
* The extreme thresholds are **percentile-based**, meaning in very quiet or very noisy periods, “extreme” may shift rapidly; use your eyes alongside the indicator.
* Because the script uses historical data and smoothing, earlier bars may differ from real-time behavior.
* Past behavior is no guarantee of future performance. Use proper risk management and test ideas on historical data before trading live.
---
## Inputs & Customization
* **Anchor** mode: Session VWAP (intraday) or EMA
* **Lookback window** and **smoothing EMA** for computing z
* **Extreme percentile** (e.g. 90) to define ±z thresholds
* **Auto / ADX-based tuning** to allow dynamic parameter changes in trending vs chop markets
* **Regime filter** (EMA slope or ADX) to restrict signals to trending conditions
* **Color settings** for inside vs outside extremes, background shading, zero line, Δz style, labels, etc.
* **Show/hide labels**, choose Δz style (columns, histogram, line, etc.)
---
## Why It’s Useful
By combining standard-score normalization with adaptive thresholds and regime sensitivity, AZM helps you see **relative momentum extremes** in a way that adjusts to market regime shifts. The dual visual cues (line color + background) reduce ambiguity at a glance.
---
---
## Features & Concept
* Computes **z = (price – anchor) / σ**, where the anchor is either Session VWAP (intraday) or EMA (non-intraday).
* Uses exponential moving averages (EWMA) to adaptively estimate the running mean and variance, making the indicator responsive to regime changes.
* Defines an **adaptive extreme threshold** (±z threshold) based on the chosen percentile of |z| over a lookback window (e.g. 90th percentile) — dynamically adjusting to volatility environment.
* Colors the main z-line **differently when inside vs. outside the extreme thresholds**, giving immediate visual feedback.
* Optionally shades the background when momentum is over the extremes (bullish or bearish).
* Supports a **self-tuning mode** (ADX-aware) that tightens or relaxes lookback/smoothing in strong trend vs. chop regimes.
* Regime filtering options (EMA slope or ADX threshold) let you filter signals in trend vs. non-trend markets.
* Plots Δz (the change in z) in various styles to help detect acceleration or deceleration in momentum.
* Adds optional thrust/fade labels to highlight when z crosses ±extreme zones, or when momentum stalls.
---
## How to Use
* Look for **z crossing** above zero (bullish momentum) or below zero (bearish momentum).
* When **z enters the extreme band**, it suggests strong momentum; when it exits, that may indicate exhaustion or reversal.
* Watch **Δz** (momentum acceleration) for clues of weakening or strengthening momentum before z itself reacts.
* Use the **regime filter** to enforce that signals only count in favorable directional markets.
* Customize inputs: lookback window, smoothing length, extreme percentile, ADX/auto settings, colors, etc., to match your trading style and timeframe.
*Use VWAP as the anchor on intraday/session charts — because it resets each session, it highlights deviations from session “fair value” and captures volume-flow bias.
*Use EMA on swing or multi-day charts — it doesn’t reset, so it preserves trend structure and gives a smoother momentum baseline across sessions.
*In trending markets, EMA tends to deliver more reliable momentum extremes; in range or mean-reversion regimes, VWAP often gives more intuitive reversal zones.
---
## Limitations & Disclaimers
* Like all indicators, AZM is **lagging** (though adaptive) and should not be used as a standalone entry/exit trigger — always combine with price action, structure, or confirmation.
* The extreme thresholds are **percentile-based**, meaning in very quiet or very noisy periods, “extreme” may shift rapidly; use your eyes alongside the indicator.
* Because the script uses historical data and smoothing, earlier bars may differ from real-time behavior.
* Past behavior is no guarantee of future performance. Use proper risk management and test ideas on historical data before trading live.
---
## Inputs & Customization
* **Anchor** mode: Session VWAP (intraday) or EMA
* **Lookback window** and **smoothing EMA** for computing z
* **Extreme percentile** (e.g. 90) to define ±z thresholds
* **Auto / ADX-based tuning** to allow dynamic parameter changes in trending vs chop markets
* **Regime filter** (EMA slope or ADX) to restrict signals to trending conditions
* **Color settings** for inside vs outside extremes, background shading, zero line, Δz style, labels, etc.
* **Show/hide labels**, choose Δz style (columns, histogram, line, etc.)
---
## Why It’s Useful
By combining standard-score normalization with adaptive thresholds and regime sensitivity, AZM helps you see **relative momentum extremes** in a way that adjusts to market regime shifts. The dual visual cues (line color + background) reduce ambiguity at a glance.
---
Skrip sumber terbuka
Dalam semangat TradingView sebenar, pencipta skrip ini telah menjadikannya sumber terbuka, jadi pedagang boleh menilai dan mengesahkan kefungsiannya. Terima kasih kepada penulis! Walaupuan anda boleh menggunakan secara percuma, ingat bahawa penerbitan semula kod ini tertakluk kepada Peraturan Dalaman.
Penafian
Maklumat dan penerbitan adalah tidak bertujuan, dan tidak membentuk, nasihat atau cadangan kewangan, pelaburan, dagangan atau jenis lain yang diberikan atau disahkan oleh TradingView. Baca lebih dalam Terma Penggunaan.