OPEN-SOURCE SCRIPT
20 Week SMA Risk Rating
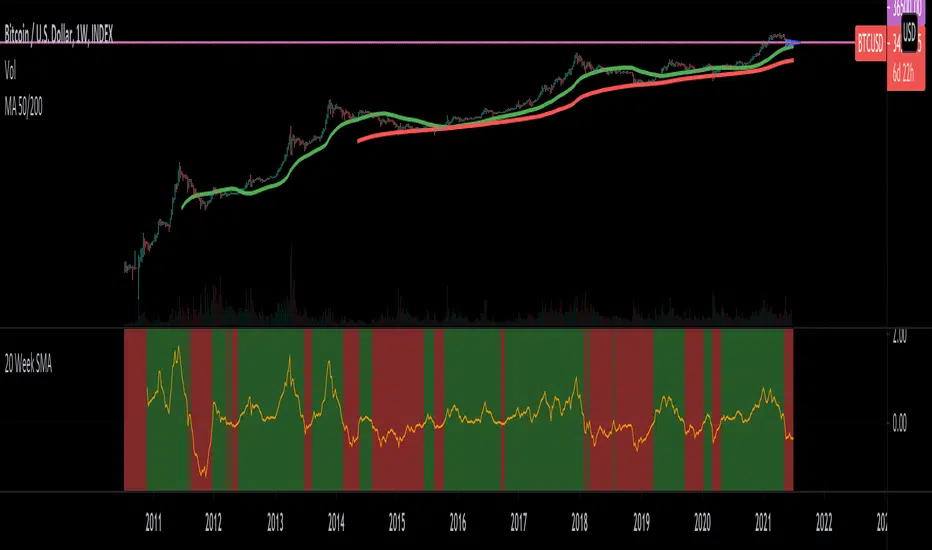
Use this indicator in the Weekly graph.
Green background indicates we are above the 20-day SMA; red background indicates we are under the 20-day SMA.
The lower we are the 20-day SMA indicates the bottom is near. The higher we are the 20-day SMA indicates there's the possibility to start climbing down.
Green background indicates we are above the 20-day SMA; red background indicates we are under the 20-day SMA.
The lower we are the 20-day SMA indicates the bottom is near. The higher we are the 20-day SMA indicates there's the possibility to start climbing down.
Skrip sumber terbuka
Dalam semangat TradingView sebenar, pencipta skrip ini telah menjadikannya sumber terbuka, jadi pedagang boleh menilai dan mengesahkan kefungsiannya. Terima kasih kepada penulis! Walaupuan anda boleh menggunakan secara percuma, ingat bahawa penerbitan semula kod ini tertakluk kepada Peraturan Dalaman.
Penafian
Maklumat dan penerbitan adalah tidak bertujuan, dan tidak membentuk, nasihat atau cadangan kewangan, pelaburan, dagangan atau jenis lain yang diberikan atau disahkan oleh TradingView. Baca lebih dalam Terma Penggunaan.