PROTECTED SOURCE SCRIPT
Dynamic Support & Resistance Zones
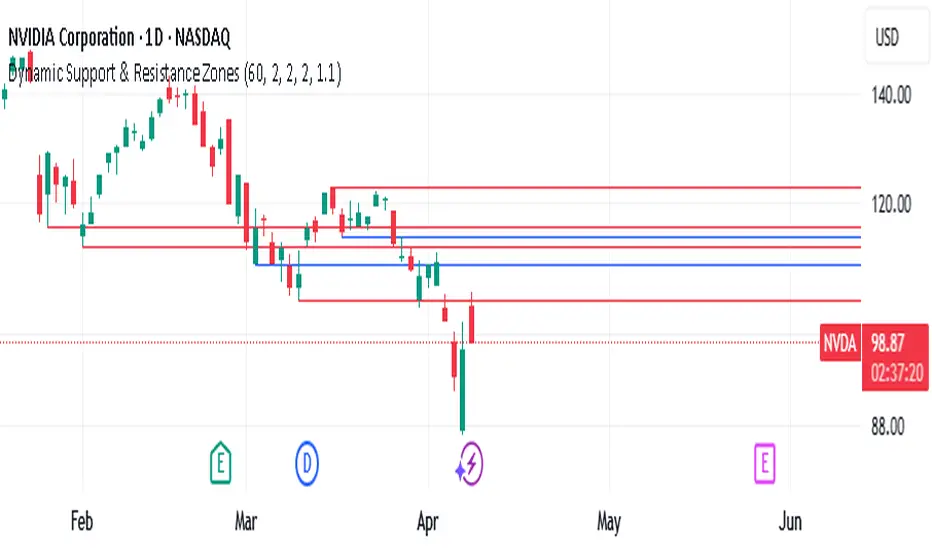
This indicator dynamically detects and plots support and resistance levels by analyzing recent price pivots. It works as follows:
Inputs:
Set the number of bars to look back, pivot strength (left/right), minimum touches for a major level, and a tolerance percentage that is converted to decimal.
Note:
• Pivot Left is the number of bars before the candidate bar that must be lower (for a swing high) or higher (for a swing low) than the candidate. It ensures the candidate is higher (or lower) than recent previous bars.
• Pivot Right is the number of bars after the candidate bar that are also required to be lower (for a swing high) or higher (for a swing low) than the candidate. This parameter is crucial because it verifies that the candidate bar wasn’t just a temporary spike—price needs to remain below (or above) the candidate for a number of subsequent bars.
Suggested default settings for a daily chart: Bars to Look Back: 60; Pivot Left: 2; Pivot Right: 2; Min Touches for Major Level: 2; Tolerance (%): 1
Pivot Detection:
It uses built-in pivot functions to identify swing highs (potential resistance) and swing lows (potential support) based on a user-defined lookback window and pivot strength.
Clustering:
Detected levels that are close (within a set tolerance) are grouped into clusters. Each cluster averages the levels and counts the number of touches. This helps determine if a zone is repeatedly tested.
Visual Display:
It plots horizontal lines on the chart:
Red lines indicate “major” zones that have been tested a number of times (as defined by the user).
Blue lines represent secondary levels that have been touched less often.
Dynamic Cleanup:
Clusters outside the user-defined lookback period are removed so that only recent, relevant levels remain visible.
In short, the indicator creates a dynamic, visually updated map of key support and resistance zones based on recent price action and pivot behavior.
Skrip dilindungi
Skrip ini diterbitkan sebagai sumber tertutup. Akan tetapi, anda boleh menggunakannya secara bebas dan tanpa apa-apa had – ketahui lebih di sini.
Penafian
Maklumat dan penerbitan adalah tidak bertujuan, dan tidak membentuk, nasihat atau cadangan kewangan, pelaburan, dagangan atau jenis lain yang diberikan atau disahkan oleh TradingView. Baca lebih dalam Terma Penggunaan.