OPEN-SOURCE SCRIPT
Telah dikemas kini Webby's RSI (Really Simple Indicator) [LevelUp]
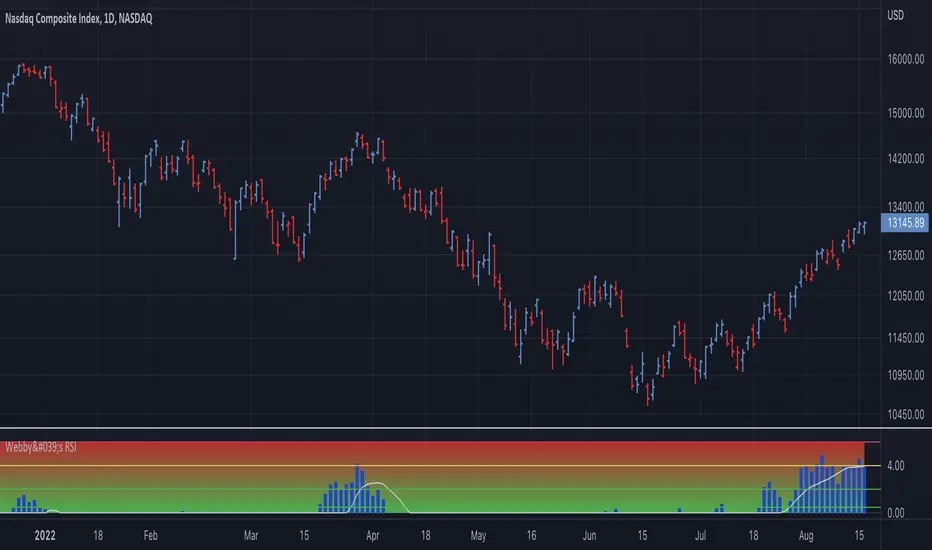
Webby's RSI (Really Simple Indicator) is a technical indicator designed to gauge the health of an uptrend. The concept and original implementation was created by Mike Webster, previously a portfolio manager for William O'Neil, founder of Investor's Business Daily.
Most often used with the Nasdaq Composite (IXIC), Webby's RSI is the percentage of the low versus the 21-day moving average. At the beginning of a bull market, the higher the value, the better, as we want to see power.
Using the zones shown on the chart:
0.5% and 2.0% - Ideal
2.0% to 4.0% - Caution
4.0%+ - Warning
Nota Keluaran
Version 2.0▪ Optional background color shown as a gradient.
▪ Customize plot type, color & moving average.
▪ Show/hide zone lines.
Skrip sumber terbuka
Dalam semangat TradingView sebenar, pencipta skrip ini telah menjadikannya sumber terbuka, jadi pedagang boleh menilai dan mengesahkan kefungsiannya. Terima kasih kepada penulis! Walaupuan anda boleh menggunakan secara percuma, ingat bahawa penerbitan semula kod ini tertakluk kepada Peraturan Dalaman.
Join traders in over 40 countries and LevelUp!
tradingview.com/spaces/LevelUpTools/
tradingview.com/spaces/LevelUpTools/
Penafian
Maklumat dan penerbitan adalah tidak bertujuan, dan tidak membentuk, nasihat atau cadangan kewangan, pelaburan, dagangan atau jenis lain yang diberikan atau disahkan oleh TradingView. Baca lebih dalam Terma Penggunaan.